NuDat 2 Description
NuDat 2 is a web application that allows users
to search and plot nuclear structure and nuclear decay data interactively.
NuDat 2 was developed by the
National Nuclear Data Center (NNDC)
at Brookhaven National Laboratory.
It provides an interface between web users and several databases containing
nuclear structure, nuclear decay and some neutron-induced nuclear reaction information.
Using NuDat 2, it is possible to search for
nuclear level properties (energy, half-life, spin-parity), gamma-ray information
(energy, intensity, multipolarity, coincidences), radiation information
following nuclear decay (energy, intensity, dose), and neutron-induced reaction data
from the ENDF/B-VII.0 library (thermal cross section and fission yields).
The information provided by NuDat 2 can be displayed
in tables, level schemes and an interactive chart of nuclides.
New features for Version 2.8
-
The Advanced Cross-Variable Plot is now available!
This tool allows users to plot observable nuclear properties for a range of nuclides.
To use it, select one observable property each for the x- and y- axes, then click 'Plot.'
-
An alternative version of the Adopted Levels, Gammas table is now available for every nuclide.
A link to this table will appear in parentheses, like so:
a list of levels (interactive ver.)
This table includes:
- checkboxes for showing/hiding each of the columns in the main table
- three more tables of information - "Additional Gamma Data," "Additional Level Data," and "Additional Gamma Comments"
- a "Band Transitions" table, which appears if the nuclide has bands of energy levels
- a "Download as .csv" button that saves the table onto the user's computer
- a sidebar menu for quick scrolling up and down the page
Please note that some of these features are at a preliminary stage and a few minor bugs may be present.
Searching NuDat 2
There are three different search forms: one for levels and gammas,
a second one for decay-related information, and a third one for
searching the Nuclear Wallet Cards file. A description of the
search capabilities can be found by clicking the help link at the
top of each form, or by following the following links:
We expect that most searches can be handled by the search forms provided;
users with interests that can't be accomodated by these forms should
not hesitate to contact us.
Glossary
A brief explanation of the many terms used in NuDat 2
can be found in this Glossary.
NuDat 2 Contents
The sections of NuDat 2 related to levels, gammas and decay
are obtained from the Evaluated Nuclear Structure Data File (ENSDF).
Physicists from around the world contribute to this effort.
The management of ENSDF resides at the NNDC.
NuDat 2 is periodically updated to reflect changes in
ENSDF.
A table with a brief statistics on NuDat 2 can be found below:
| Total number of nuclides |
3386 |
| Total number of levels |
192074 |
| Total number of levels with known half-life |
28113 |
| Total number of levels with known spin and parity |
147551 |
| Total number of gamma rays |
295868 |
| Total number of gamma rays with known multipolarity |
97633 |
| Total number of alpha transitions |
2291 |
| Total number of Beta- and EC/Beta+ transitions |
16260 |
| Total number of gamma-gamma coincidences |
4238535 |
A relational database is used to store the data. Structured Query Language (SQL) commands
are issued to access the database. NuDat 2 relies on
Java to accomplish its programming tasks.
Terms of Use
This disclaimer applies
to all BNL web products, including NuDat 2.
NuDat 2 contains evaluated nuclear data - i.e. recommended values
following a careful analysis of the available data. We can not, however, guarantee the accuracy
of the data or the absence of errors in the application. Users are urged to promptly report
any problems encountered when using NuDat 2.
User should be aware that NuDat 2 contents change often as new data are incorporated.
Users should feel free to use the information from NuDat 2
(tables and plots) in their work, reports, presentations, articles and books.
For those interested in quoting NuDat 2, we suggest
using the following citation format:
National Nuclear Data Center, information extracted from the NuDat 2 database, https://www.nndc.bnl.gov/nudat2/
Interactive Chart of Nuclides
Experimentally known nuclei are represented by a cell in a chart
with the number of neutrons on the horizontal axis and the
number of protons on the vertical axis.
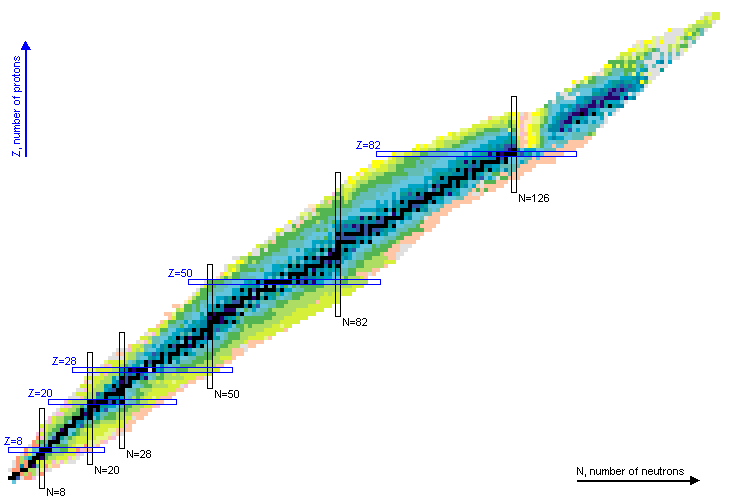 |
| Chart of Nuclides, with Zoom=7 and colored according to half-life |
The color of the cell is used to indicate different ground state properties:
- Half-life: half-life in seconds.
- Decay Mode: predominant decay mode.
- Qβ-: β- Q-value, in keV.
- QEC: electron capture Q-value, in keV.
- Qβ+: positron emission Q-value, in keV.
- Sn: neutron separation energy, in keV.
- Sp: proton separation energy, in keV.
- Qα: alpha Q-value, in keV.
- ΔQα=0.5 x ( Qα(Z+2,N+2) - Qα(Z,N) ), in keV.
- Q2β-: double β- Q-value, in keV.
- Q2EC: double electron capture Q-value, in keV.
- QECP: electron capture following by proton emission Q-value, in keV.
- Qβ-n: beta-delayed neutron emission Q-value, in keV.
- Qβ-2n: beta-delayed double neutron emission Q-value, in keV.
- BE/A: binding energy per nucleon, in keV.
-
(BE-LDM Fit): binding energy minus Liquid Drop model fit, divided by the number of nucleons, in keV.
The Liquid Drop model parameters are obtained from the work of Bertsch, Bulgac, Luo and McDaniel,
Liquid Drop Model of Nuclear Binding Energy,
and are: volume: 15.74063 MeV, surface: 17.61628 MeV, symmetry: 23.42742 MeV, Coulomb: 0.71544 MeV and
pairing: 12.59898 MeV.
- Pairing gap, PG=0.5 x (-1)N x ( 2BE(Z,N) - BE(Z,N-1) -BE(Z,N+1) ), in keV, where BE is the binding energy.
- E1st ex. st.: energy of the first excited state, in keV. Only unambiguous cases are plotted.
- E2+: energy of the first excited state with spin and parity equal to 2+ for even-even nuclei, in keV.
- E4+: energy of the first excited state with spin and parity equal to 4+ for even-even nuclei, in keV.
- E4+/E2+: the ratio of the two above-mentioned quantities, which should be about 3.3 for deformed nuclides and about 2 for spherical ones.
- E3-: energy of the first excited state with spin and parity equal to 3- for even-even nuclei, in keV.
-
β2: quadrupole deformation parameter obtained from the B(E2) value, as explained in the 2001 work of
Raman et al.
Basically,
β2=(4π/3ZR20)[B(E2)]1/2,
where R0=1.2A1/3, Z and A are the number of protons and the number of nucleons respectively, and the B(E2)
values are obtained from ENSDF. B(E2) values can have large uncertainties, or be defined as
upper/lower limits. The cell will not be colored for the latter cases and furhermore, it will not be colored if the uncertainty
of the derived β2 exceeds 50%.
-
B(E2)42/B(E2)20: ratio of reduced transition probabilities, B(E2) values, for the
gamma transition connecting the first 4+ state to the first 2+ state, and the gamma transition connecting
the first 2+ state to the ground state, for even-even nuclei. B(E2) values can have large uncertainties, or be defined as
upper/lower limits. The cell will not be colored for the latter cases and furhermore, it will not be colored if the uncertainty
of the derived B(E2)42/B(E2)20 exceeds 50%.
- σ(n,γ): thermal neutron capture cross section at 300 K, in barns.
- σ(n,F): thermal neutron fission cross section at 300, K in barns.
-
235U FY: thermal neutron-induced fission yields for 235-Uranium.
The fission yields are normalized so that their sum is equal to 2.
-
239Pu FY: thermal neutron-induced fission yields for 239-Plutonium.
The fission yields are normalized so that their sum is equal to 2.
-
252Ca FY: spontaneous fission yields for 252-Californium.
The fission yields are normalized so that their sum is equal to 2.
The following quantities are obtained from the Nuclear Wallet Cards database:
Half-life, Decay Mode.
The following quantities are obtained or derived from the ENSDF database:
E2+, E4+, E3-, E4+/E2+,
β2 and B(E2)42/B(E2)20.
The following quantities are obtained or derived from the 2016 Atomic Mass Evaluation by
M. Wang et al.:
Qβ-, QEC, Qβ+,
Sn, Sp,
Qα, ΔQα, Q2β-,
Q2EC, QECP, Qβ-n,
BE/A, BE-LDM fit (see statement above regarding the LDM parameters), Pairing gap.
The following quantities are obtained or derived from the ENDF/B-VII.1 database:
σ(n,γ), σ(n,F), 235U FY, 239Pu FY, 252Ca FY.
Fission yields are only given for ground state levels.
We strongly recommend using the Sigma
web application to obtain more complete information on these quantities.
It should be kept in mind that there are nuclei whose ground state have more than one decay mode,
or nuclei that have levels with a wide range of half-lives.
The color scheme used here over-simplifies the description of a nucleus by choosing just one color.
As a result, the chart should be only used as a visualization tool.
It is advised to use the full list of levels for a complete information about decay modes and half-lives.
A logarithmic scale is used when the color code is set to Half-life,
E1st ex. st., E2+, E4+, E3-,
σ(n,γ), σ(n,F), 235U FY and 239Pu FY.
These measurements can quickly change by several orders of magnitude,
and a linear scale would leave some details hidden.
The other numerical data are plotted in a linear scale.
The color scale is fixed when the color code is set to "Half-life", "Decay Mode",
or any of the excited states and fission yields. That is, the cell color will be
the same regardless of the zoom.
For all the other coloring possibilities, the color scale floats around the view port.
That is, a dark red is assigned to the highest
most positive value in the viewport, while a dark purple
is assigned to the most negative one.
Please don't hesitate to contact us if you would like to see some other coloring possibilites.
The chart can be seen with 7 different zooming options.
With the largest zoom value, the entire chart is displayed and the magic numbers
(8, 20, 28, 50, 82 and 126) are indicated.
For smaller zoom values, only a fraction of the chart is displayed; the nucleus
at the center of the viewing window is marked with a magenta border;
neutron ( horizontal axis ) and proton numbers ( vertical axis ) are indicated.
When the zoom level is equal to 1, the nucleus' name, ground state half-life,
two most probable decay modes, and natural abundance are displayed.
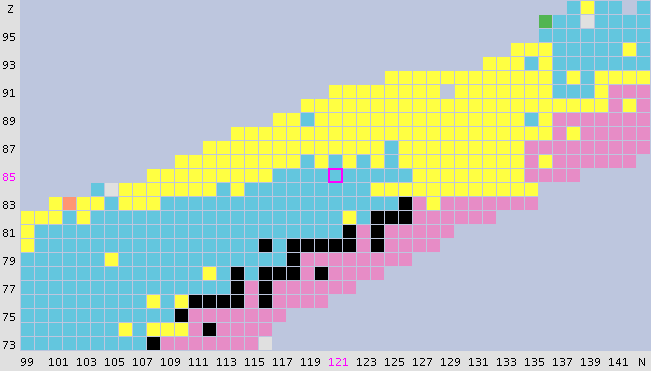 |
|
Chart of Nuclides, with Zoom = 3, colored according to
decay mode and centered on 206At
|
Ground and isomeric state information can be obtained by clicking on a given nucleus.
This information is displayed under the chart of nuclides.
Links to a list of levels, a level scheme, and decay radiation information are provided when available.
Unless the zoom is at the largest value, clicking on a given nucleus also re-centers the chart.
Further navigation possibilities can be obtained by using the arrows on the right-top corner
of the window, as well as the 'Nucleus' textbox under the zoom control.
In order to optimize the transfer of information when using the interactive chart of nuclides,
pop-up boxes (tooltips) containing level information have been implemented.
The tooltips are triggered when the mouse is over a given nucleus on the chart.
JavaScript functions and image mapping are used to produce this effect.
An example can be seen in the figure below.
 |
|
Chart of Nuclides, with Zoom = 1, colored according to half-life and
centered on 44Ti.
Tooltips are ON with the mouse over the 44Ti cell.
|
Slow computers and slow internet browsers will be challenged by the tooltips,
specially at the largest zoom. Users can choose to turn the tooltips feature off
using the control menu on the right side in the main page. Fast browsers, such as
Mozilla Firefox, respond well on
slow computers and internet connections.
The chart images can be produced with two width values.
In the wide screen mode, images are around 920 pixels in width, while in the
narrow screen mode, images are around 740 pixels in width.
In order to view the whole screen properly, the monitor should be set at a resolution width
larger than the image width plus 200 pixels.
Level Schemes
As mentioned before, a link to a web page with a levels plot is provided
after clicking on a given nucleus.
An example is shown in the figure below:
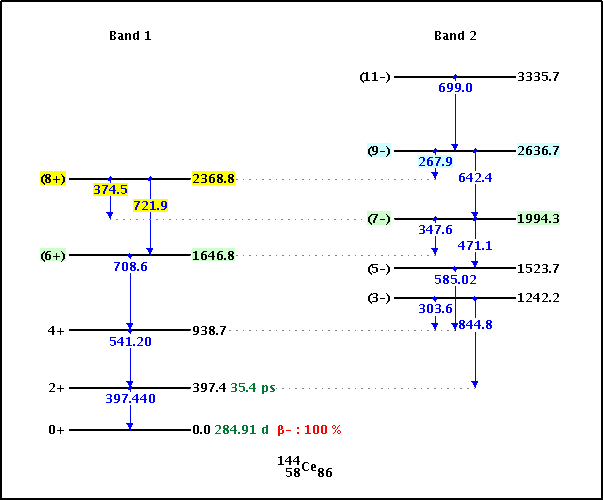 |
| Partial level scheme for 144Ce. |
The level scheme is rendered in a single image.
Most nuclei, however, have complex level schemes that won't fit in just one image. As a consequence,
only selected parts of the level scheme should be plotted at a time using
the interactive features provided
Levels are plotted in vertical groups.
Each band is assigned to a group; levels that are not known to belong to a band,
labeled as "Non-band levels", are also plotted in vertical groups.
The way these non-band levels are plotted is based solely on energy-spacing considerations to avoid overwriting, that is,
there is no physics behind how these levels are grouped in vertical structures; a change of image size or
energy limits will likely modify the way these levels appear plotted.
The first time the level scheme is plotted, all levels will be included.
A form at the top of the plot can be used to replot with the following possibilities:
- Select lower and upper energy limits.
- Write gamma energies.
- Write level energies.
- Write level half-lives.
- Write level spin and parities.
- Highlight a single level, that is, the level information will appear with a bright yellow background
while other levels directly feeding or being fed by the highlighted level will appear with a lighter
background.
- Choose the image height in pixels.
- Choose the level width in pixels.
- Choose the vertical group spacing in pixels.
- Exclude or include bands and groups of levels.
Levels with unknown value of absolute energy but with a known relative energy,
like instance levels noted as X+500, are plotted at an
arbitrarily choosen value of 200 keV from the ground state, i.e. X+500
will appear at 700 keV.
Additionally, the neutron separation Energy (Sn) and the proton separation energy (Sp)
are indicated in the level scheme.
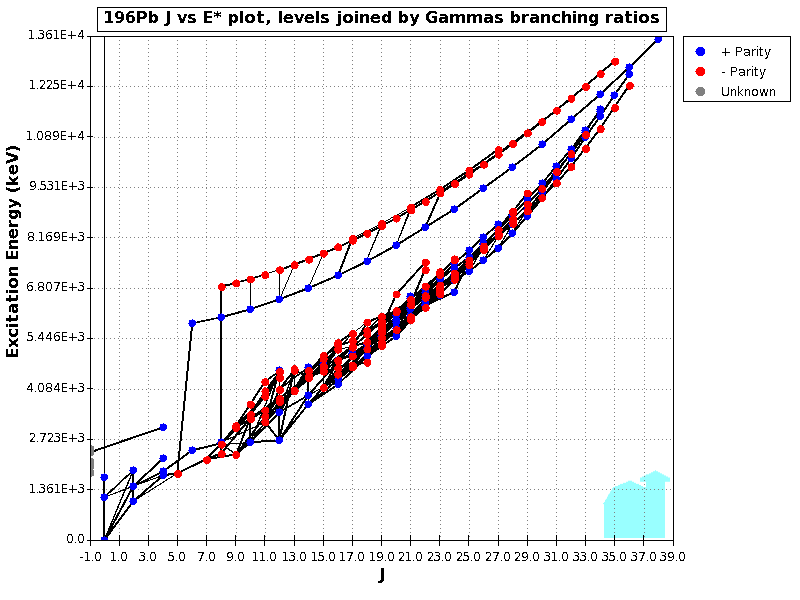
Spin versus excitation energy (J vs E*) plots
A link to a web page with a J vs E* plot
is provided after clicking on a given nucleus.
An example of it can be seen in the figure below:
In these plots, positive parity levels are plotted with a blue symbol,
negative parity with a red symbol, while levels of unknown spin or parity
are plotted with a gray symbol.
The levels can be joined by the gamma branching ratios or reduced transition probabilities,
with the thickness of the line proportional to the magnitude of the branching ratio or probability.
In these plots, only levels with defined numerical energy are included.
It is also possible to plot J(J+1) in the horizontal axis instead of J.
A preliminary numerical output of the plots is also available.
Please, don't hesitate to email your comments
Back to NuDat 2
NuDat 2 database manager and web programming:
Alejandro A. Sonzogni, NNDC, Brookhaven National Laboratory
(sonzogni@bnl.gov)