Advanced Cross-Variable Plot
Select one observable property for each axis below.
Then click 'Plot' to generate a graph.
X-Axis
X-value
Z
N
A
Ground state half-life
Q
β-
Q
EC
Q
β+
S
n
S
p
Q
α
ΔQ
α
S
2n
S
2p
Q
2β-
Q
2EC
Q
ECp
Q
β-n
Q
β-2n
BE/A
(BE-LDM Fit)/A
Pair. gap
E
1st ex. st.
E
2+
E
3-
E
4+
E
6+
E
4+
/E
2+
E
6+
/E
2+
E
6+
/E
4+
β
2
B(E2)
4+→2+
B(E2)
2+→0+
B(E2)
4+→2+
/ B(E2)
2+→0+
Maxwellian-avg. σ(n,γ)
235
U FY
239
Pu FY
252
Cf-avg σ(n,γ)
252
Cf FY
1
st
E
0+
1
st
E
2+
X Min:
X Max:
Logarithmic X-scale
Y-Axis
Y-value
Z
N
A
Ground state half-life
Q
β-
Q
EC
Q
β+
S
n
S
p
Q
α
ΔQ
α
S
2n
S
2p
Q
2β-
Q
2EC
Q
ECp
Q
β-n
Q
β-2n
BE/A
(BE-LDM Fit)/A
Pair. gap
E
1st ex. st.
E
2+
E
3-
E
4+
E
6+
E
4+
/E
2+
E
6+
/E
2+
E
6+
/E
4+
β
2
B(E2)
4+→2+
B(E2)
2+→0+
B(E2)
4+→2+
/ B(E2)
2+→0+
Maxwellian-avg. σ(n,γ)
235
U FY
239
Pu FY
252
Cf-avg σ(n,γ)
252
Cf FY
1
st
E
0+
1
st
E
2+
Y Min:
Y Max:
Logarithmic Y-scale
≤ Z ≤
≤ N ≤
All
Even Z - Even N
Odd Z - Even N
Even Z - Odd N
Odd Z - Odd N
Image Width:
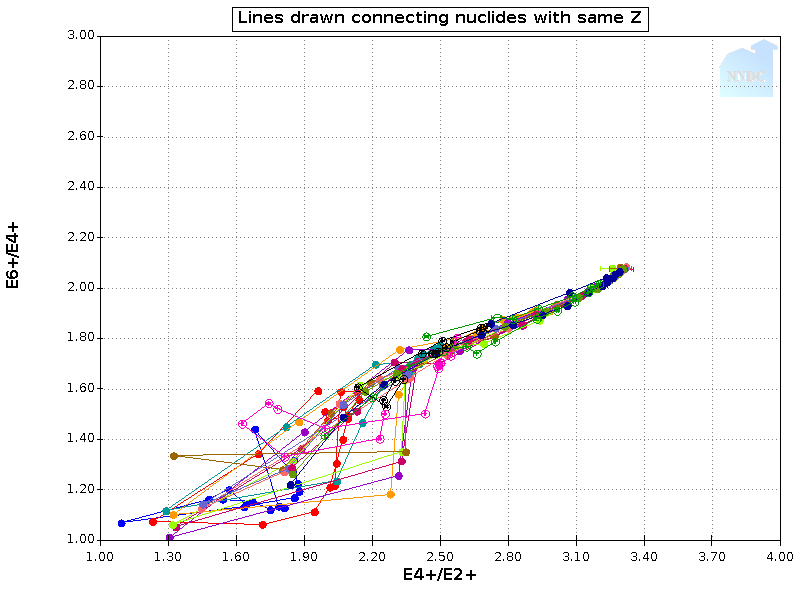
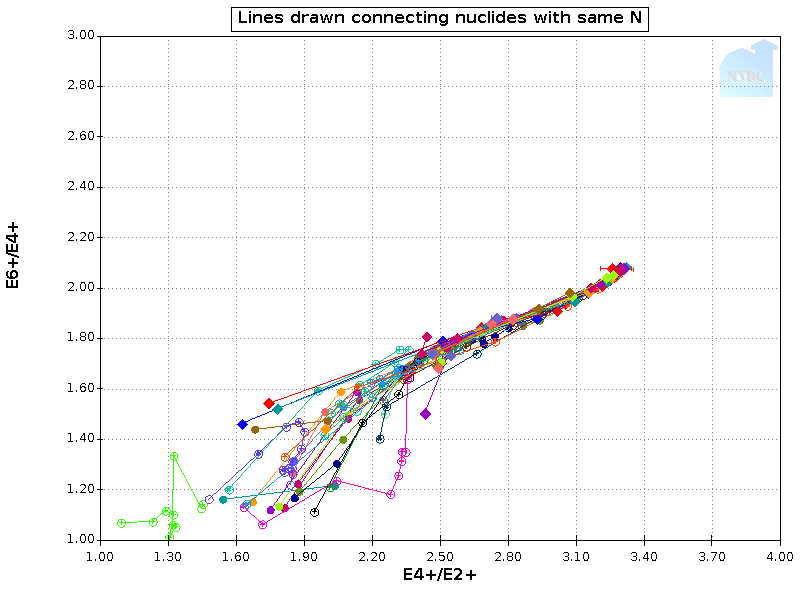
Draw lines
Plot
Show data points
Download data as .txt
❮
❯
Hide data points
Hide data points