
NuDat 3 User Guide
Introduction
NuDat is a web application that allows users to search and plot nuclear structure and nuclear decay data interactively. NuDat was developed by the National Nuclear Data Center (NNDC) at Brookhaven National Laboratory. It provides an interface between web users and several databases containing nuclear structure, nuclear decay and some neutron-induced nuclear reaction information.
Using NuDat, it is possible to search for nuclear level properties (energy, half-life, spin-parity), gamma-ray information (energy, intensity, multipolarity, coincidences), radiation information following nuclear decay (energy, intensity, dose), and neutron-induced reaction data from the ENDF/B-VII.0 library (thermal cross section and fission yields).
The information provided by NuDat can be displayed in tables, level schemes and an interactive chart of nuclides.
NuDat 2 was implemented by Alejandro Sonzogni at the National Nuclear Data Center (NNDC) at Brookhaven National Laboratory.
Contact Us
NuDat 3 is actively maintained and updated by the National Nuclear Data Center (NNDC) at Brookhaven National Laboratory. The NNDC plans to modernize and update all of our web applications using feedback provided by the community.
Please direct questions, comments and suggestions to Donnie Mason at the NNDC: dmason@bnl.gov.
New Features
-
The interactive chart of nuclides has been updated with:
- Smooth pan and zoom using intuitive gestures
- A movable current nucleus display with a search field and a zoom to slider
- An expandable menu with additional controls and features
- Filter by ground and isomeric state properties
- Sync 1-D plots to current chart view
- Export nuclear structure and nuclear decay data as a:
- CSV
- PNG
- Shareable link
- A rescale button to set the color key to the minimum and maximum values of the current chart view
-
The 1-D neutron and proton plots have been updated with:
- A collapsible sidebar display
- Smooth pan and zoom using intuitive gestures
- A zoom button to zoom to a selected area
- Clickable data points and an interactive color key to highlight the currently selected line
- Linear and logarithmic Y-axis scales
- Export plotted data as a:
- CSV
- PNG
-
The Advanced Cross-Variable
Plot has been updated with:
- Smooth pan and zoom using intuitive gestures
- A zoom button to zoom to a selected area
- Filter by ground and isomeric state properties
- Clickable data points and an interactive color key to highlight the currently selected line
- Multiple axis scales
- Export plotted data as a:
- CSV
- PNG
- The Advanced Cross-Variable Plot is now available! This tool allows users to plot observable nuclear properties for a range of nuclides. To use it, select one observable property each for the X and Y axes, then click 'Plot.'
-
An alternative
version of the Adopted Levels & Gammas table is now available for every nuclide.
This updated table includes:
- Checkboxes for showing/hiding each of the columns in the main table
- Three more tables of information - "Additional Gamma Data," "Additional Level Data," and "Additional Gamma Comments"
- A "Band Transitions" table, which appears if the nuclide has bands of energy levels
- A "Download as .csv" button that saves the table onto the user's computer
- A sidebar menu for quick scrolling up and down the page
Searching NuDat
There are three different search forms: one for levels and gammas, a second one for decay-related information, and a third one for searching the Nuclear Wallet Cards file.
A description of the search capabilities can be found by clicking the help link at the top of each form, or by following the following links:
Glossary
A brief explanation of the many terms used in NuDat can be found in this glossary.
NuDat Contents
The sections of NuDat related to levels, gammas and decay are obtained from the Evaluated Nuclear Structure Data File (ENSDF). Physicists from around the world contribute to this effort. The management of ENSDF resides at the NNDC. NuDat is periodically updated to reflect changes in ENSDF.
A table with a brief statistics on NuDat can be found below:
| Total number of nuclides | 3386 |
| Total number of levels | 186928 |
| Total number of levels with known half-life | 27268 |
| Total number of levels with known spin and parity | 142836 |
| Total number of gamma rays | 287054 |
| Total number of gamma rays with known multipolarity | 92513 |
| Total number of alpha transitions | 2156 |
| Total number of Beta- and EC/Beta+ transitions | 15568 |
| Total number of gamma-gamma coincidences | 3978052 |
A relational database is used to store the data. Structured Query Language (SQL) commands are issued to access the database. NuDat relies on Java to accomplish its programming tasks.
Terms of Use
This disclaimer applies to all BNL web products, including NuDat.
NuDat contains evaluated nuclear data - i.e. recommended values following a careful analysis of the available data. We cannot, however, guarantee the accuracy of the data or the absence of errors in the application. Users are urged to promptly report any problems encountered when using NuDat.
Users should be aware that NuDat contents change often as new data is incorporated.
Users should feel free to use the information from NuDat (tables and plots) in their work, reports, presentations, articles and books. For those interested in quoting NuDat, we suggest using the following citation format:
National Nuclear Data Center, information extracted from the NuDat database, https://www.nndc.bnl.gov/nudat/
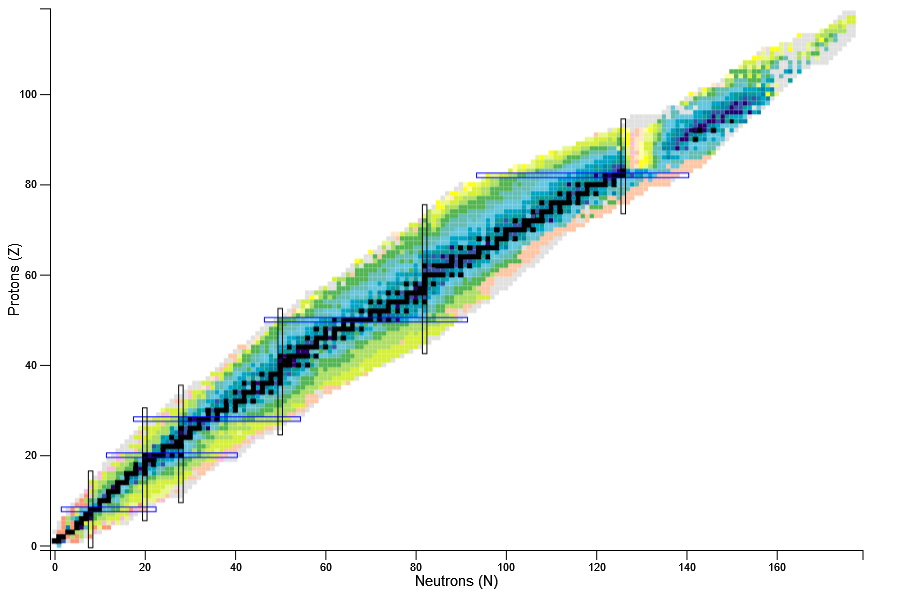
Interactive Chart of Nuclides
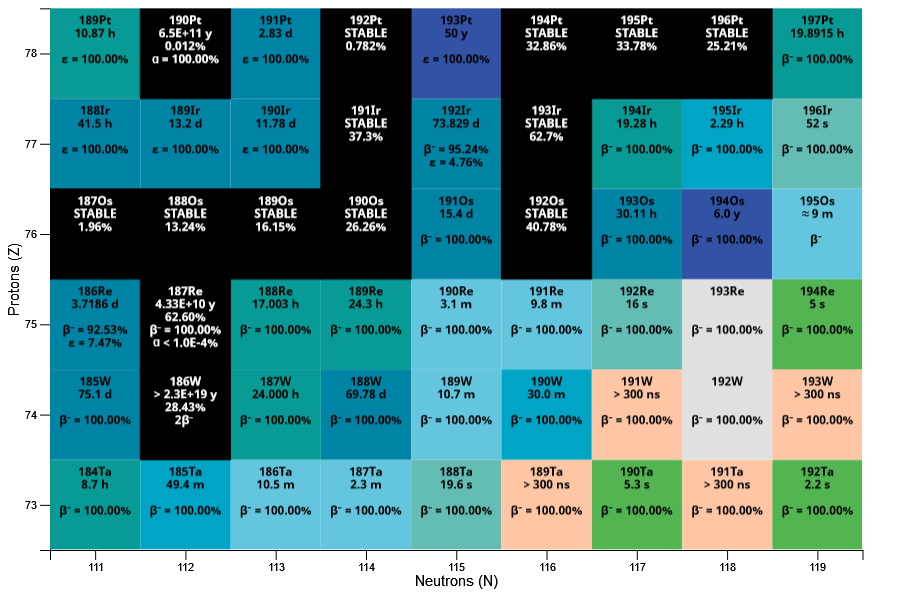
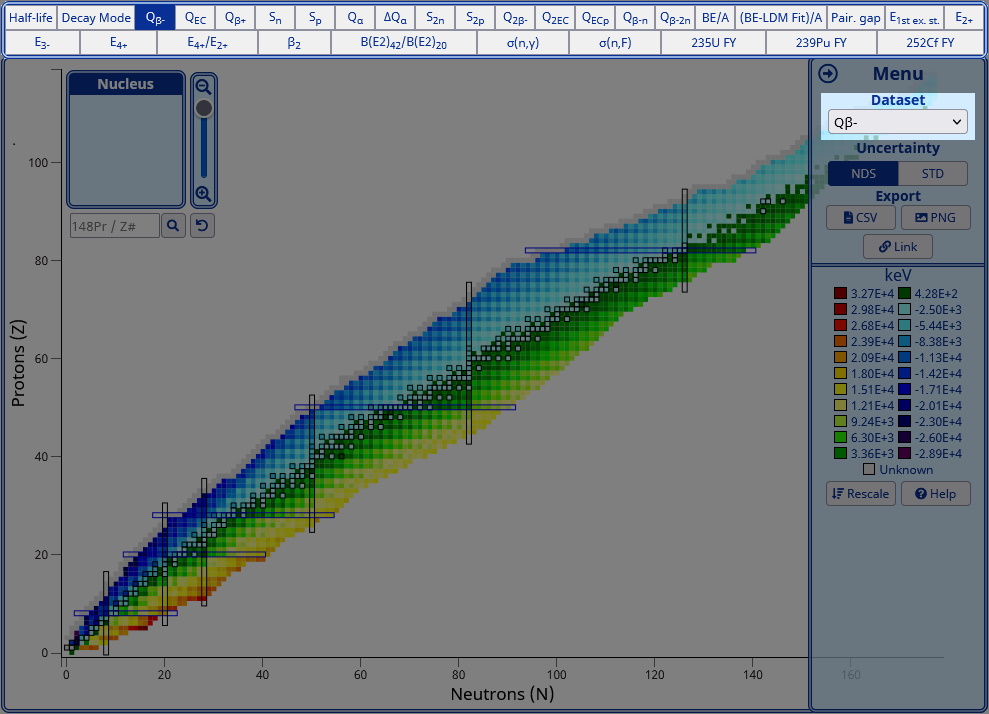
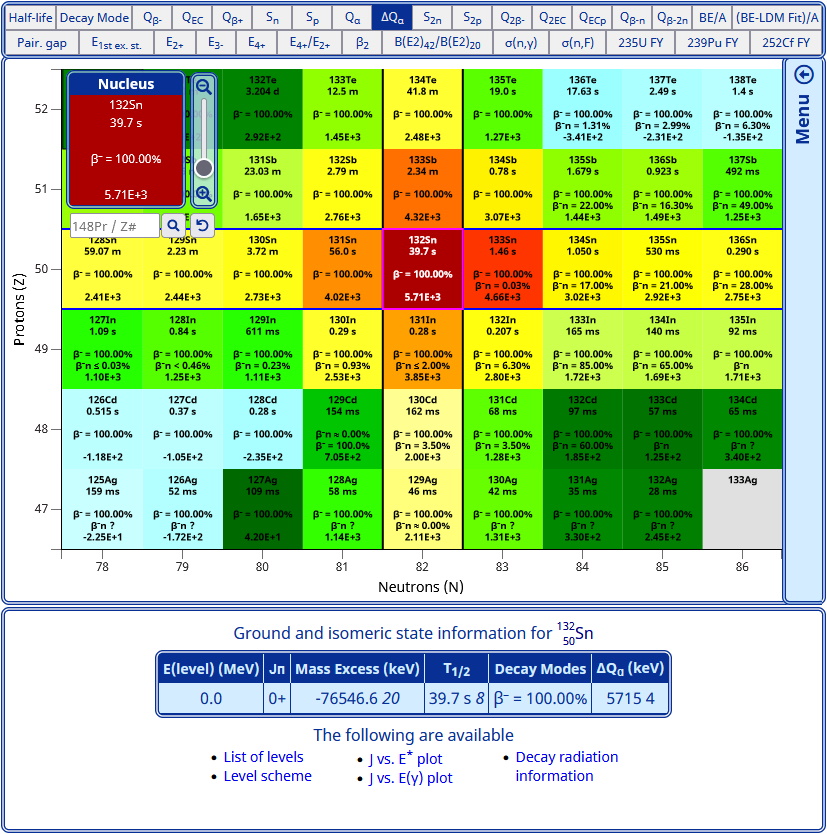
Experimentally known nuclei are represented by a cell in the chart with the number of neutrons on the horizontal axis and the number of protons on the vertical axis. The chart can display multiple levels of zoom using the scroll wheel, pinch gestures on touch devices, or the zoom slider. When fully zoomed out, the entire chart is displayed and the magic numbers (8, 20, 28, 50, 82 and 126) are indicated. When zoomed in, only a fraction of the chart is displayed. Zooming in reveals additional information within each nucleus' cell and mouseover tooltips become more detailed. When fully zoomed in, the nucleus' name, ground state half-life, two most probable decay modes, natural abundance and the value for the currently selected property are displayed.
Ground and isomeric state information can be obtained by clicking on a given nucleus. This information is displayed under the chart of nuclides. Links to a list of levels, a level scheme, and decay radiation information are provided when available.
Ground State Properties
The color of the cell is used to indicate different ground state properties:
- Half-life: half-life in seconds.
- Decay Mode: predominant decay mode.
- Qβ-: β- Q-value, in keV.
- QEC: electron capture Q-value, in keV.
- Qβ+: positron emission Q-value, in keV.
- Sn: neutron separation energy, in keV.
- Sp: proton separation energy, in keV.
- Qα: alpha Q-value, in keV.
- ΔQα=0.5 x ( Qα(Z+2,N+2) - Qα(Z,N) ), in keV.
- Q2β-: double β- Q-value, in keV.
- Q2EC: double electron capture Q-value, in keV.
- QECP: electron capture followed by proton emission Q-value, in keV.
- Qβ-n: beta-delayed neutron emission Q-value, in keV.
- Qβ-2n: beta-delayed double neutron emission Q-value, in keV.
- BE/A: binding energy per nucleon, in keV.
- (BE-LDM Fit): binding energy minus Liquid Drop model fit, divided by the number of nucleons, in keV. The Liquid Drop model parameters are obtained from the work of Bertsch, Bulgac, Luo and McDaniel, Liquid Drop Model of Nuclear Binding Energy, and are: volume: 15.74063 MeV, surface: 17.61628 MeV, symmetry: 23.42742 MeV, Coulomb: 0.71544 MeV and pairing: 12.59898 MeV.
- Pairing gap, PG=0.5 x (-1)N x ( 2BE(Z,N) - BE(Z,N-1) -BE(Z,N+1) ), in keV, where BE is the binding energy.
- E1st ex. st.: energy of the first excited state, in keV. Only unambiguous cases are plotted.
- E2+: energy of the first excited state with spin and parity equal to 2+ for even-even nuclei, in keV.
- E4+: energy of the first excited state with spin and parity equal to 4+ for even-even nuclei, in keV.
- E4+/E2+: the ratio of the two above-mentioned quantities, which should be about 3.3 for deformed nuclides and about 2 for spherical ones.
- E3-: energy of the first excited state with spin and parity equal to 3- for even-even nuclei, in keV.
-
β2: quadrupole deformation parameter obtained from the B(E2) value, as explained in the 2001
work of
Raman et al.
Basically,
β2=(4π/3ZR20)[B(E2)]1/2,
where R0=1.2A1/3, Z and A are the number of protons and the number of nucleons respectively, and the B(E2) values are obtained from ENSDF. B(E2) values can have large uncertainties, or be defined as upper/lower limits. The cell will not be colored for the latter cases and furthermore, it will not be colored if the uncertainty of the derived β2 exceeds 50%. - B(E2)42/B(E2)20: ratio of reduced transition probabilities, B(E2) values, for the gamma transition connecting the first 4+ state to the first 2+ state, and the gamma transition connecting the first 2+ state to the ground state, for even-even nuclei. B(E2) values can have large uncertainties, or be defined as upper/lower limits. The cell will not be colored for the latter cases and furthermore, it will not be colored if the uncertainty of the derived B(E2)42/B(E2)20 exceeds 50%.
- σ(n,γ): thermal neutron capture cross section at 300 K, in barns.
- σ(n,F): thermal neutron fission cross section at 300 K, in barns.
- 235U FY: thermal neutron-induced fission yields for 235-Uranium. The fission yields are normalized so that their sum is equal to 2.
- 239Pu FY: thermal neutron-induced fission yields for 239-Plutonium. The fission yields are normalized so that their sum is equal to 2.
- 252Ca FY: spontaneous fission yields for 252-Californium. The fission yields are normalized so that their sum is equal to 2.
Data Sources
The data used within NuDat is obtained and derived from a variety of trusted sources. Below details each data source and the corresponding quantities.
The Nuclear Wallet Cards database:
- Half-life
- Decay Mode
- Ground and Isomeric State Information Table
- Level Energy
- Jπ
The ENSDF database:
- E2+
- E4+
- E3-
- E4+/E2+
- β2
- B(E2)42/B(E2)20
The 2020 Atomic Mass Evaluation by M. Wang
- Mass Excess
- Qβ-
- QEC
- Qβ+
- Sn
- Sp
- Qα
- ΔQα
- Q2β-
- Q2EC
- QECP
- Qβ-n
- BE/A
- BE-LDM fit (see the statement above regarding the LDM parameters)
- Pairing gap.
- σ(n,γ)
- σ(n,F)
- 235U FY
- 239Pu FY
- 252Ca FY
Note
Please note that fission yields are only given for ground state levels. We strongly recommend using the Sigma web application to obtain more complete information on these quantities.
Additionally, it should be kept in mind that there are nuclei whose ground state have more than one decay mode, or nuclei that have levels with a wide range of half-lives. The color scheme used here over-simplifies the description of a nucleus by choosing just one color. As a result, the chart should be only used as a visualization tool. It is advised to use the full list of levels for complete information about decay modes and half-lives.
A logarithmic scale is used when the color code is set to Half-life, E1st ex. st., E2+, E4+, E3-, σ(n,γ), σ(n,F), 235U FY and 239Pu FY. These measurements can quickly change by several orders of magnitude, and a linear scale would leave some details hidden. The other numerical data are plotted in a linear scale.
The color scale is fixed when the color code is set to "Half-life", "Decay Mode", any of the excited states or fission yields. That is, the cell color will be the same regardless of the zoom. For all the other coloring possibilities, the color scale floats around the viewport. That is, a dark red is assigned to the highest most positive value in the viewport, while a dark purple is assigned to the most negative one.
Please don't hesitate to contact us if you would like to see some other coloring possibilities.
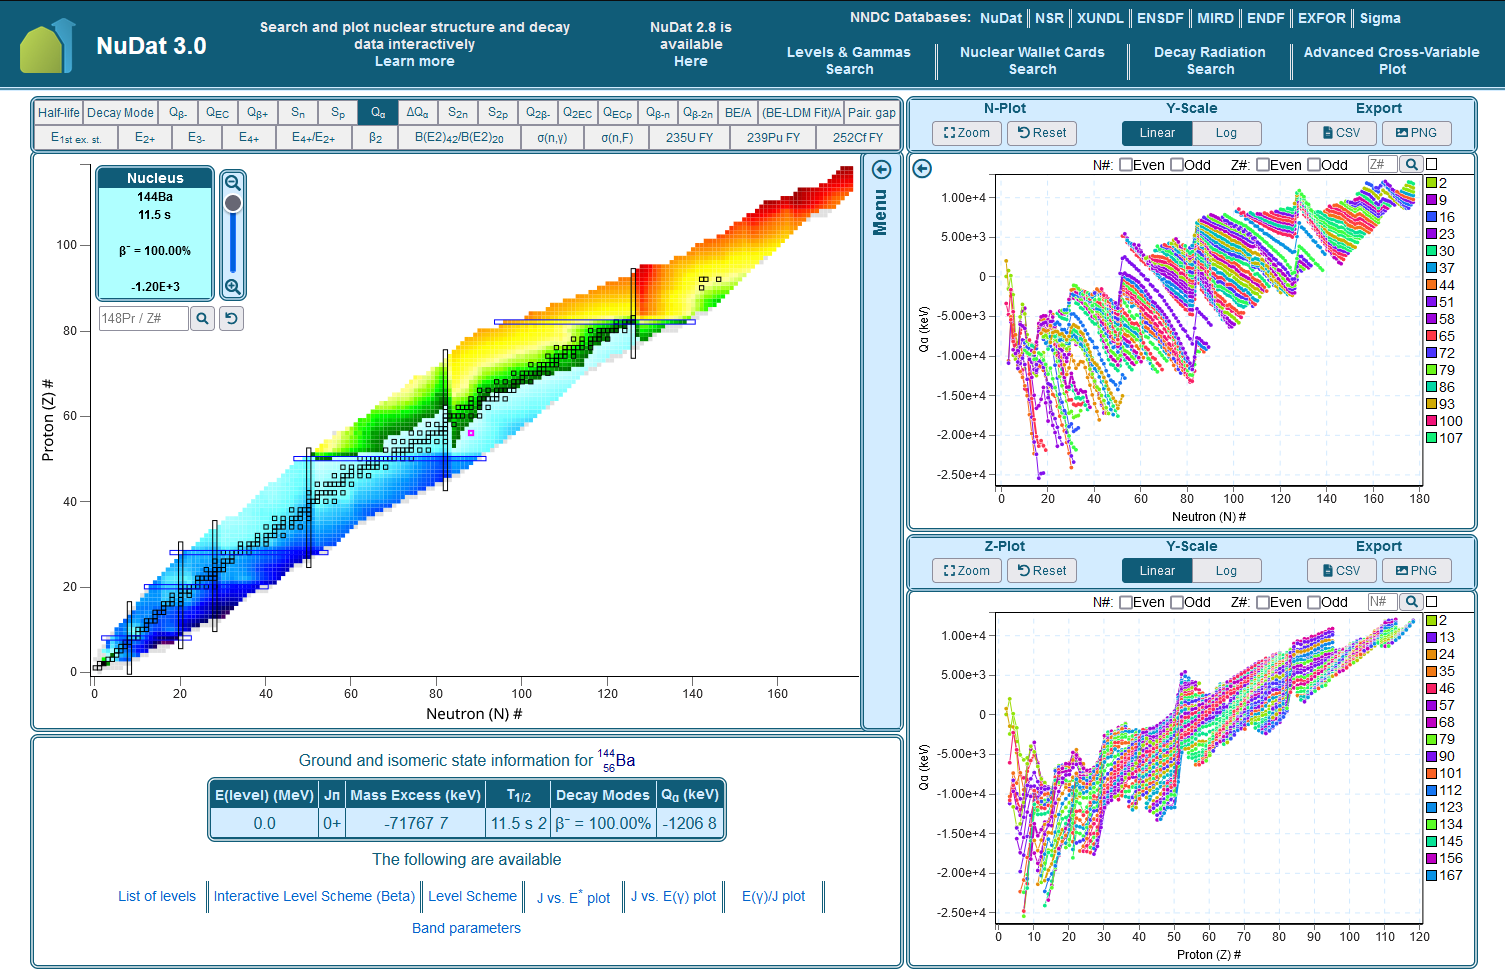
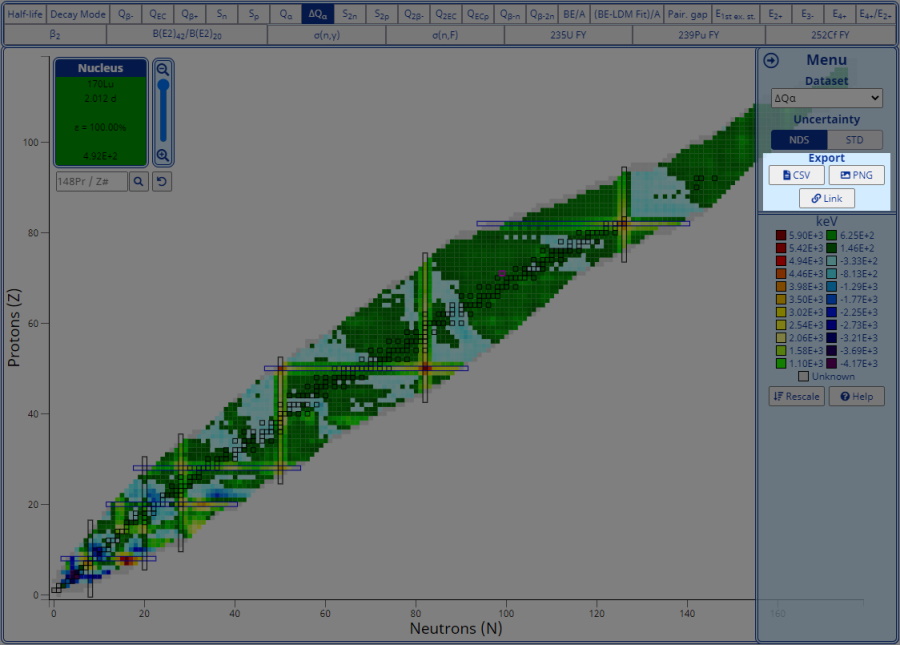
Overview
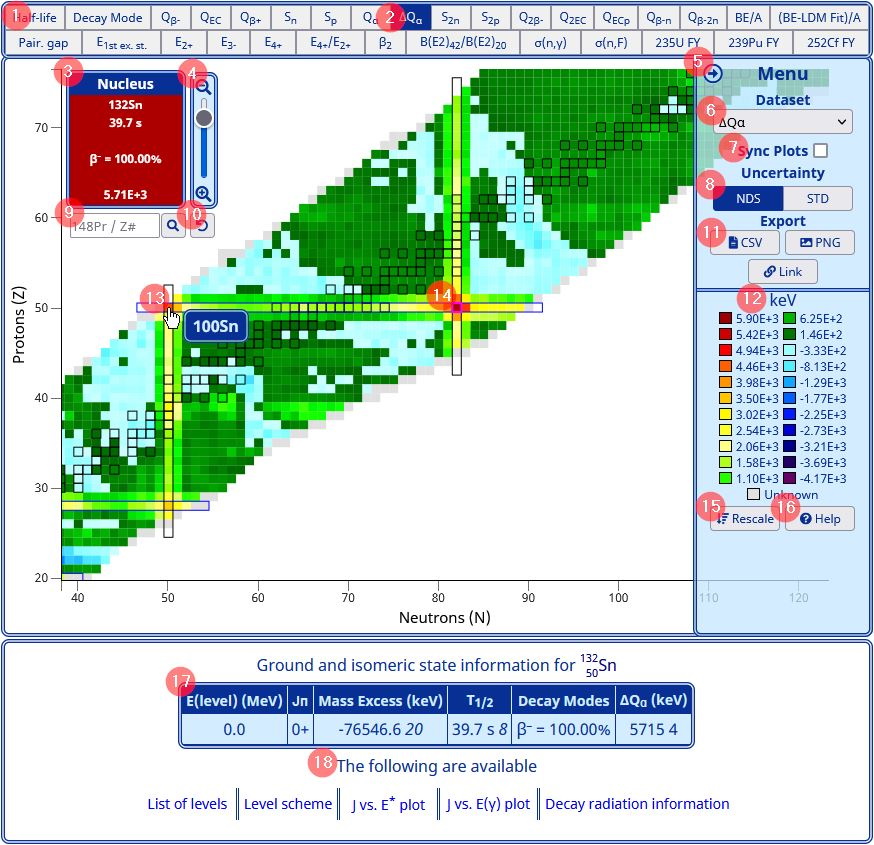
- Dataset buttons: select from all of the datasets to update the chart display.
- Current dataset: the button of the currently selected dataset is highlighted. In this case, ΔQα is displayed on the chart of nuclides.
- Current nucleus: a movable display of the currently selected nucleus with search, zoom and reset controls.
- Zoom slider: drag the slider to zoom in and out with the currently selected nucleus as the center point.
- Collapsible Menu: press the arrow to collapse or expand a side menu with additional controls.
- Dataset dropdown: select from all the datasets using a dropdown selector.
- Sync Plots: check to automatically sync the 1-D neutron and proton plots to the view of the chart of nuclides
- Uncertainty format: select either nuclear data sheets (NDS) or standard (STD) format for uncertainty values.
- Nucleus search: enter the name or proton number of the nucleus and press the search button to select the desired nucleus. The chart will snap to the selected nuclide at the current zoom level.
- Reset button: press to reset the chart to the default state.
- Export buttons: export all NuDat data as a CSV or export the current chart view as a PNG or shareable link.
- Color key: displays the units and cell colors with associated values in a key. Datasets such as half-life and decay mode have fixed scales. In this case, ΔQα is displayed with a fluid scale dependent on minimum and maximum values in keV.
- Tooltips: hover over a nuclide cell to reveal a tooltip with additional information. Tooltips vary based on the current zoom level and the selected dataset.
- Highlighted cell: the cell of the currently selected nuclide is highlighted with a magenta border.
- Rescale button: press to scale the color key to the minimum and maximum values of the current chart view.
- Help button: press to navigate to the help page.
- Data table: the ground and isomeric state information for the currently selected nucleus is displayed below the chart of nuclides.
- Additional links: available links with additional information for the currently selected nucleus are displayed below the data table.
Interactive Chart Controls
NuDat 3's fully interactive chart of nuclides heavily relies on client-side JavaScript for interactions. To take full advantage of NuDat 3, we recommend using the most up-to-date version of your preferred browser with JavaScript enabled. Online resources, such as the one found here, can assist in updating your browser and activating JavaScript.
Selecting a Dataset
Users can select a dataset using the grid of buttons at the top of the chart or the dropdown selector within the expandable menu on the right. Both controls are synched and indicate the currently selected property. Qβ- is currently selected in the highlighted example below.
Selecting a Nuclide
Clicking on a nucleus' cell will select the hovered nucleus and highlight the corresponding cell with a magenta border. In the upper left corner of the chart of nuclides, a current nucleus display will update with the currently selected nucleus' data. A search field is located below this display and can be used to select a nucleus by entering the name or proton number. Entering a proton number in the search field will select the first stable isomer with the entered number of protons. In the cases where no isomers are stable, the longest lived is selected.
The currently selected nucleus display can be moved by pressing and dragging on the top portion of the container.
For the examples below, the currently selected dataset is proton separation energy (Sp) and the currently selected nucleus is 152Gd. Up to six lines of data can be displayed here and within the nucleus' cell when fully zoomed in.
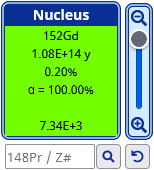
- Name: 152Gd
- Half-life: 1.08E+14 y
- Abundance: 0.20%
- Most probable decay mode: α=100%
- Second most probable decay mode: none
- Selected dataset value: 7.34E+3
From top to bottom:
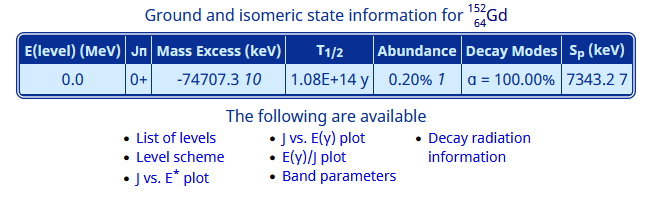
Ground and isomeric state information for the currently selected nucleus is located below the chart of nuclides. Links with additional information are available as well.
Panning the Interactive Chart
Users can pan around the chart of nuclides by pressing and dragging on the chart.
Zooming on the Interactive Chart
Users can quickly zoom in and out on the chart of nuclides using the scroll wheel or pinch gestures for touch devices. The chart will zoom with the hovered position as the center point.
Zooming using the Zoom Slider
In the upper left corner of the chart of nuclides, the currently selected nucleus display has a zoom slider attached on its right side. The slider will zoom towards the currently selected nucleus. The demonstration below shows that additional information is added within a nucleus' cell when zooming in.
Exporting to CSV
There are three export options within the expandable menu, located on the right side of the chart of nuclides.
Export to CSV to download every nucleus' ground and isomeric state information used within the chart of nuclides.
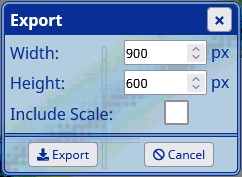
Exporting to PNG
After pressing the export PNG button, a window will appear with additional options. The width and height can be specified in pixels from 900px by 600px to 2400px by 1600px. The aspect ratio of the exported chart is locked to 3:2. The "Include Scale" checkbox will include the color scale in the right margin of the PNG.
Exporting as a Shareable Link
An export link button was implemented to support collaboration and can be used to share specific views of the chart of nuclides. When pressed, a link to the current state of the chart is copied to the user's clipboard. Users can then paste the link and share their exact chart view.
For example, if a user wanted to share the above view for the ΔQα of 132Sn, the following link is generated:
1-D Neutron and Proton Plots
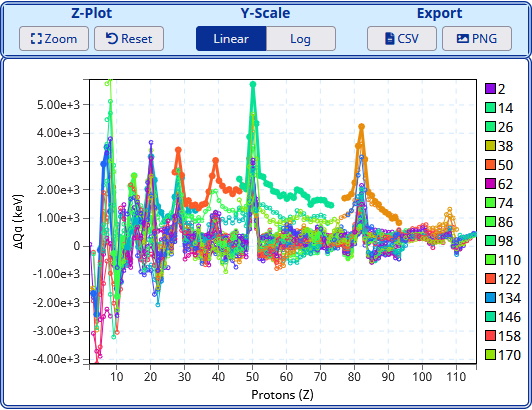
Two 1-D plots accompany the chart of nuclides and display the currently selected dataset as a function of number of neutrons and number of protons. The dataset selected within the chart of nuclides is plotted on the Y-axis. For the neutron 1-D plot, the X-axis plots the number of neutrons and points are connected by the same number of protons. Conversely, for the proton 1-D plot, the X-axis plots the number of protons and points are connected by the same number of neutrons.
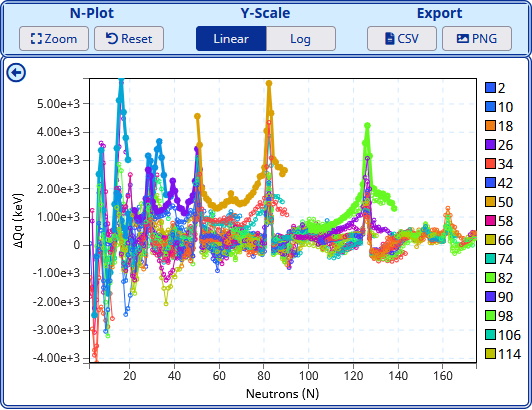
Overview
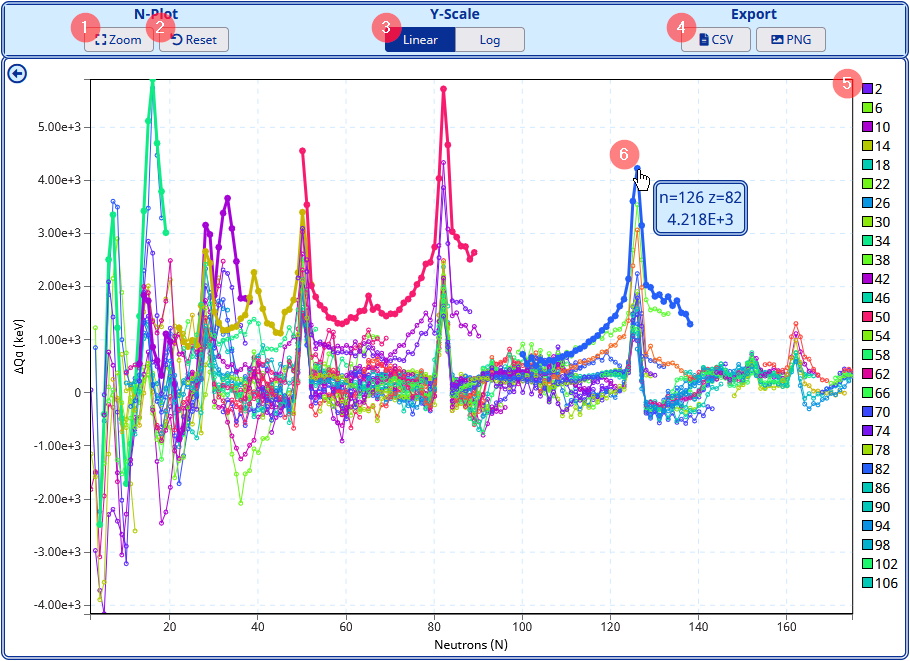
- Zoom button: after clicking, users can select an area on the plot to zoom to by clicking and dragging around the desired region.
- Reset button: resets the plot to the default state.
- Y-Scale buttons: plots are in their default Y-axis scaling, but can be changed to a linear or logarithmic scale using these buttons.
- Export buttons: download the data used in the plot as a CSV or export the current plot view as a PNG
- Color key: an interactive color key is located on the right side of the plot. This key will show a limited number of colors for the corresponding proton numbers in the neutron plot, and the corresponding neutrons in the proton plot. Hovering over the key will highlight the targeted line, and clicking will select that line to preserve the highlight effect.
- Data Points: hover over a data point to display a tooltip with the corresponding information. Clicking a data point selects and highlights the corresponding line.
1-D Plot Controls
The 1-D plots share similar controls with the interactive chart of nuclides. The plots can be navigated with similar pan and zoom gestures. Additionally, users can export the data used within the plots as a CSV, or export the current plot view as a PNG. The following sections will describe interactions that differ from the chart of nuclides.
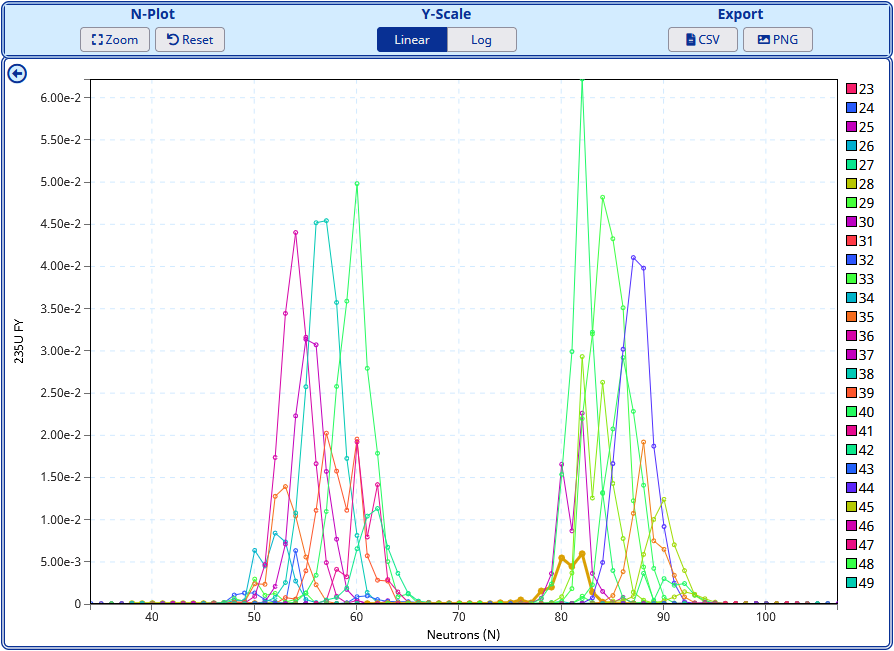
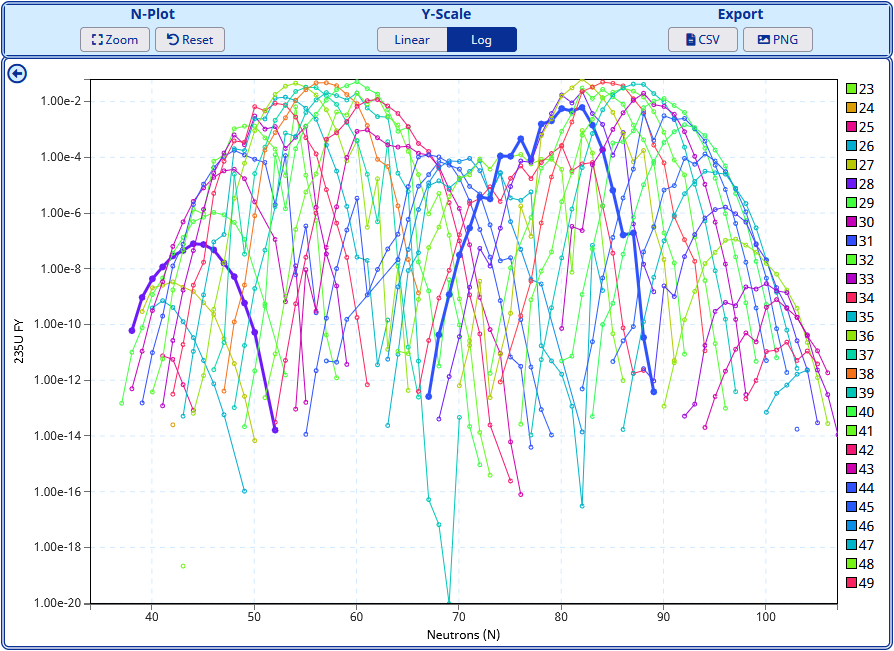
Selecting a Y-axis scale
Measurements that can quickly change by several orders of magnitude have a logarithmic scale by default. A linear scale would leave some details hidden. Clicking the corresponding buttons at the top of the plots will change the Y-axis scale between linear and logarithmic.
Selecting Lines
The color key on the right side of the plot can be hovered to highlight the targeted line. Clicking on the color key or a specific data point will select the corresponding line and preserve the highlight effect. The highlight will be visible in PNG exports. Double click to deselect the line and remove its highlight, or use the reset button to reset the entire plot. The highlighted line is preserved between dataset changes as well.
Zooming using the Zoom Button
Click the zoom button at the top of the plot and then press and drag across a region of interest on the plot. The region is indicated by a transparent gray box with the start drag position as a corner and the end drag position as the opposite corner. On drag release, the plot will zoom to the selected area. The zoom mode will return to the standard panning and zooming once an area is selected or the user double-clicks on the plot.
Advanced Cross-Variable Plot
Plot observable nuclear properties by selecting properties for the X and Y axes. Group the data points by same Proton (Z) #, Neutron (N) #, Atomic Mass (A) #. Further customize the plot by selecting axis scales, filtering the data, drawing lines or displaying uncertainty values.
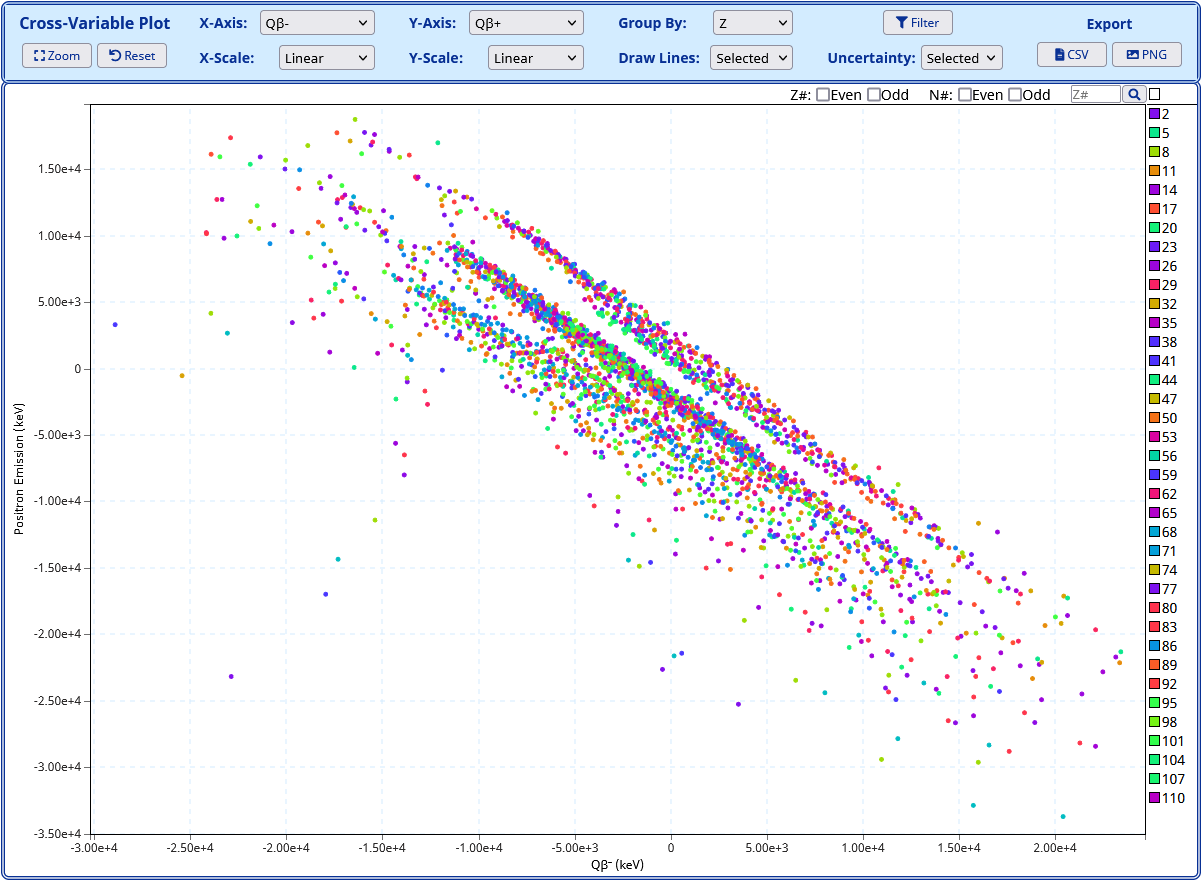
Overview
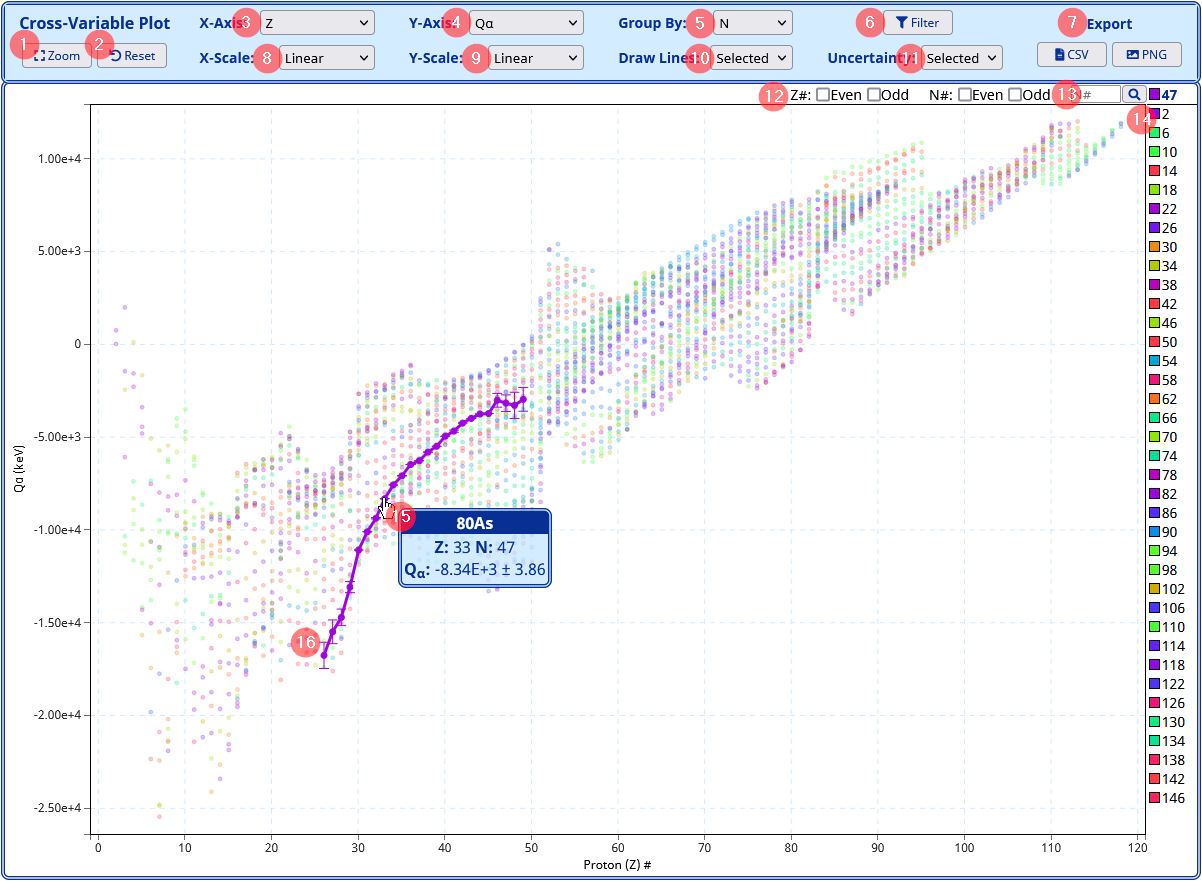
- Zoom button: after clicking, users can select an area on the plot to zoom to by clicking and dragging around the desired region.
- Reset button: resets the plot to the default state.
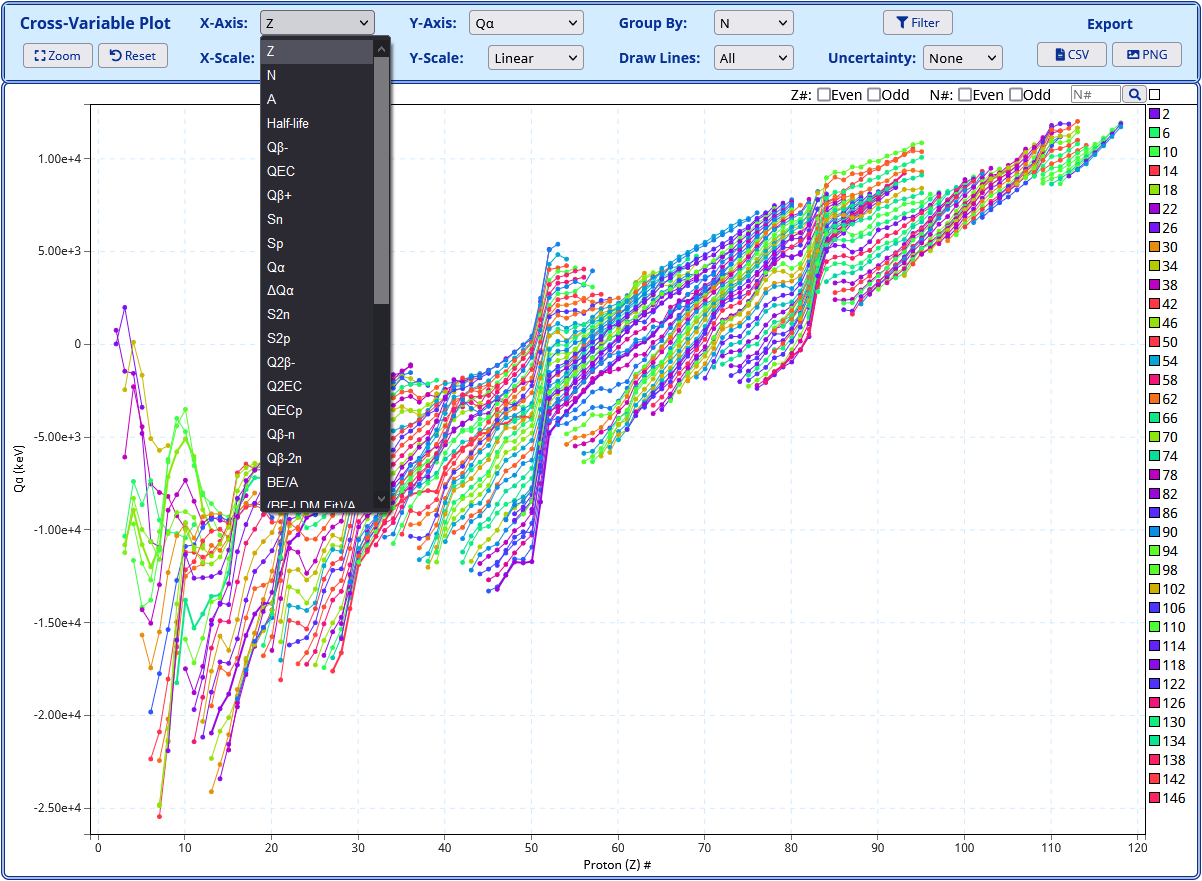
- X-Axis dropdown: select an observable property to plot on the X-axis.
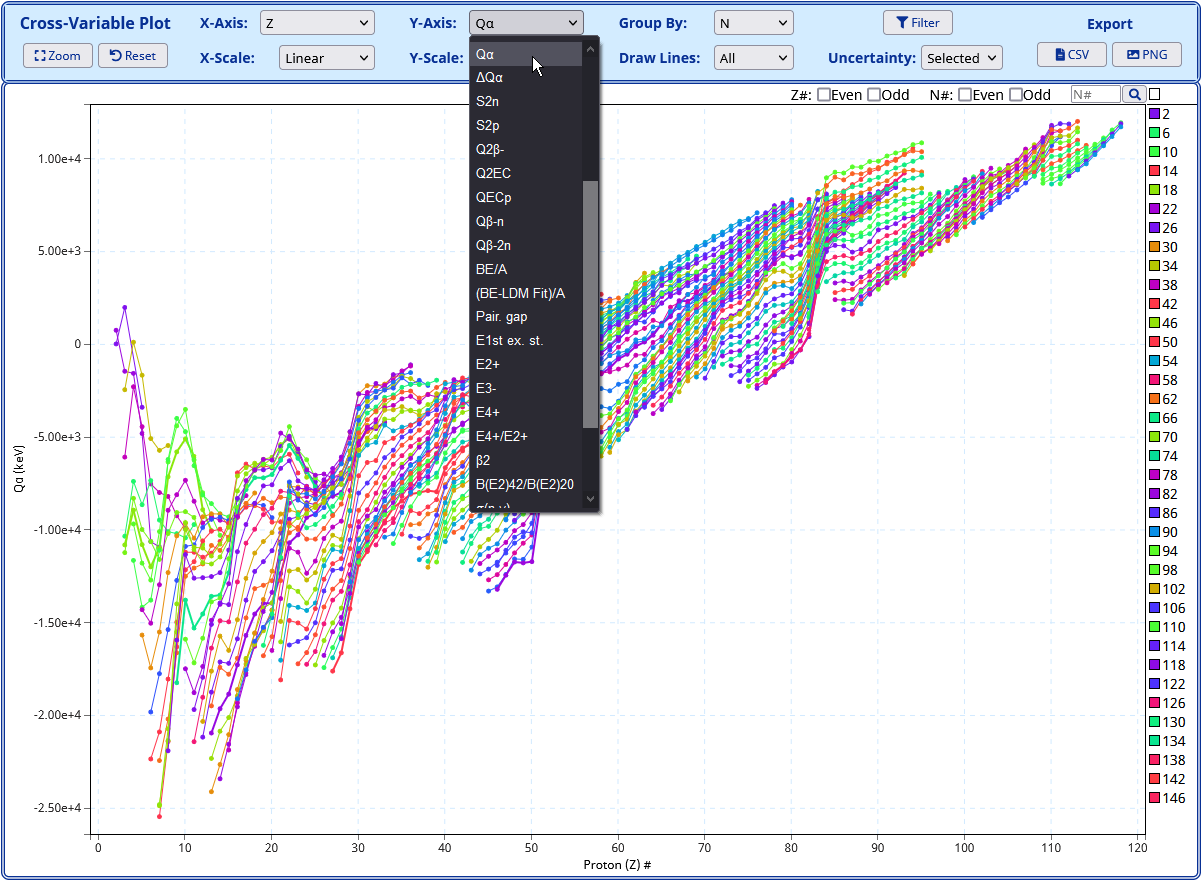
- Y-Axis dropdown: select an observable property to plot on the Y-axis.
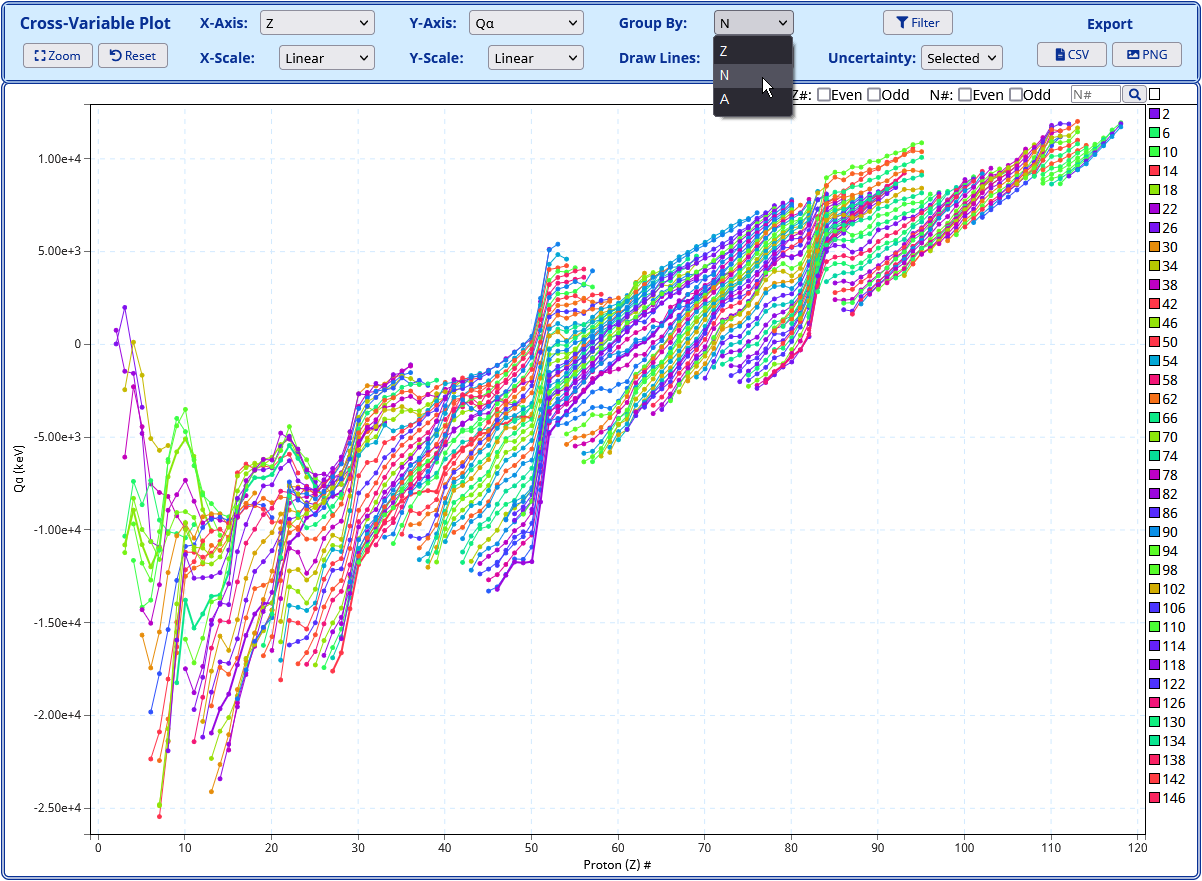
- Group By dropdown: select Proton (Z) #, Neutron (N) #, Atomic Mass (A) # to group the data points.
- Filter Button: click to open a filter window to filter by observable properties.
- Export buttons: download the data used in the plot as a CSV or export the current plot view as a PNG
- X-Scale dropdown: select X-axis scale.
- Y-Scale dropdown: select Y-axis scale.
- Draw Lines dropdown: select whether to draw lines for the selected points, all points or none.
- Uncertainty dropdown: select whether to draw the uncertainty for the selected points, all points or none.
- Odd/Even checkboxes: check to display odd or even values for Proton (Z) # or Neutron (N) #. No selection or odd and even checked for a value will display all values.
- Grouped by search: enter a number and press the search button to select the desired points grouped by (Z, N, A). The plot will highlight the corresponding points.
- Color key: an interactive color key is located on the right side of the plot. This key will show a limited number of colors for the corresponding values that the data is grouped by. Hovering over the key will highlight the targeted line, and clicking will select that line to preserve the highlight effect. The currently selected line is displayed at the top.
- Tooltip: hover over a data point to display a tooltip with the nuclide name, Proton (Z) #, Neutron (N) # and selected observable properties.
- Data Points: clicking a data point selects and highlights the corresponding points. By default lines through the points and uncertainties are drawn for the highlighted points.
Advanced Cross-Variable Plot Controls
The Advanced Cross-Variable Plot has the same pan and zoom controls as the 1-D plots described above. Similarly, users can export the data used within the plot as a CSV, or export the current plot view as a PNG. The following sections will describe customizing the plot by selecting various options and filters.
Selecting Observable Properties
Measurements that can quickly change by several orders of magnitude have a logarithmic scale by default. A linear scale would leave some details hidden. Clicking the corresponding buttons at the top of the plots will change the Y-axis scale between linear and logarithmic.
Selecting Z, N, or A to Group By
Users can group the data by Proton (Z) #, Neutron (N) # or Atomic Mass (A) # using the Group By dropdown. Grouped points share the same color and can be connected by lines. An interactive color key is located on the right side of the plot. This key will show a limited number of colors for the corresponding values that the data is grouped by.
Selecting Axis Scale
The X-Axis Scale and Y-Axis Scale dropdowns at the top of the plot can be used to select the respective axis scale. Measurements that can quickly change by several orders of magnitude have a logarithmic scale by default. A linear scale would leave some details hidden.
The following scales are available:
- Linear
- Log
- Sqrt
- Exponential
Level Schemes
As mentioned before, a link to a web page with a levels plot is provided after clicking on a given nucleus. An example is shown in the figure below:
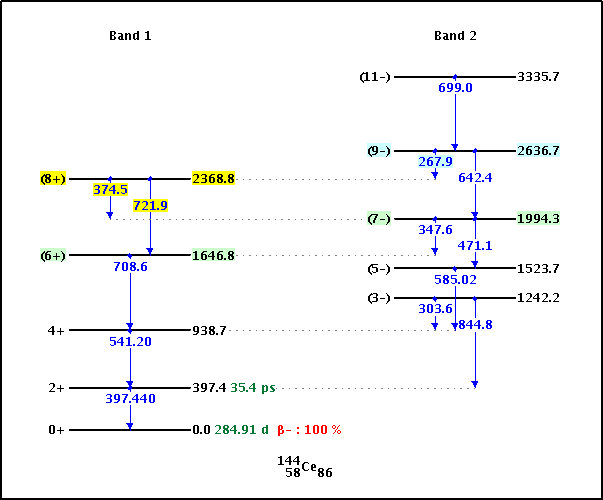
The level scheme is rendered in a single image. Most nuclei, however, have complex level schemes that won't fit in just one image. As a consequence, only selected parts of the level scheme should be plotted at a time using the interactive features provided.
Levels are plotted in vertical groups. Each band is assigned to a group; levels that are not known to belong to a band, labeled as "Non-band levels", are also plotted in vertical groups. The way these non-band levels are plotted is based solely on energy-spacing considerations to avoid overwriting, that is, there is no physics behind how these levels are grouped in vertical structures; a change of image size or energy limits will likely modify the way these levels appear plotted.
The first time the level scheme is plotted, all levels will be included. A form at the top of the plot can be used to replot with the following possibilities:
- Select lower and upper energy limits.
- Write gamma energies.
- Write level energies.
- Write level half-lives.
- Write level spin and parities.
- Highlight a single level, that is, the level information will appear with a bright yellow background while other levels directly feeding or being fed by the highlighted level will appear with a lighter background.
- Choose the image height in pixels.
- Choose the level width in pixels.
- Choose the vertical group spacing in pixels.
- Exclude or include bands and groups of levels.
Levels with unknown value of absolute energy but with a known relative energy, like instance levels noted as X+500, are plotted at an arbitrarily chosen value of 200 keV from the ground state, i.e. X+500 will appear at 700 keV. Additionally, the neutron separation Energy (Sn) and the proton separation energy (Sp) are indicated in the level scheme.
J vs E* Plots
A link to a web page with a J vs E* plot is provided after clicking on a given nucleus. An example of it can be seen in the figure below:
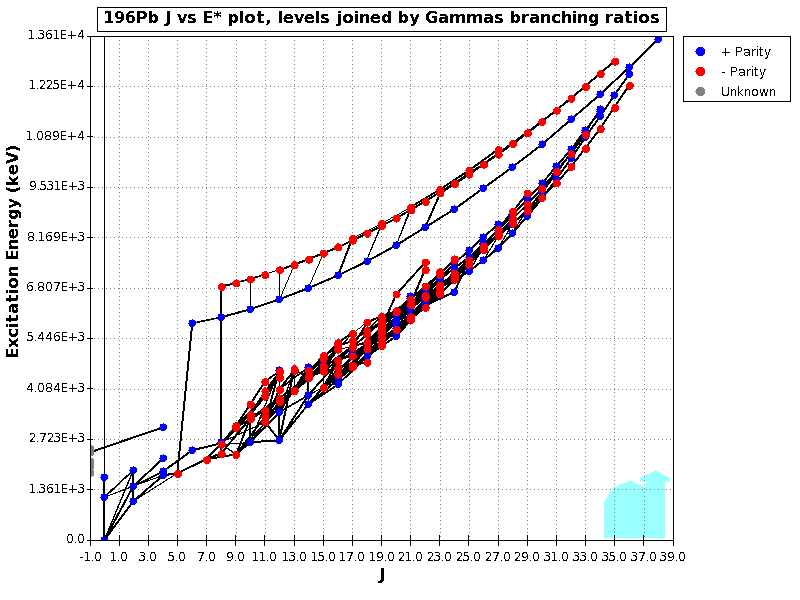
In these plots, positive parity levels are plotted with a blue symbol, negative parity with a red symbol, while levels of unknown spin or parity are plotted with a gray symbol.
The levels can be joined by the gamma branching ratios or reduced transition probabilities, with the thickness of the line proportional to the magnitude of the branching ratio or probability.
In these plots, only levels with defined numerical energy are included. It is also possible to plot J(J+1) in the horizontal axis instead of J. A preliminary numerical output of the plots is also available.
Navigation