
Beta Decay
Overview
Due to the nuclear weak force, neutrons can change into protons and vice versa. The transformation of one neutron inside a nucleus into a proton is known as β- decay. The transformation of a proton into a neutron is known as β+ decay. Additionally, a proton can become a neutron following the interaction with an orbiting electron, which is known as Electron Capture (EC):
β-: neutron -> proton + electron + anti-ν
β+: proton -> neutron + positron + ν
Electron Capture: proton + electron -> neutron + ν
The original nucleus with Z proton, N neutrons will gain or lose a proton/neutron but will maintain the same number or nucleons:
β-: (Z,N,A) -> (Z+1,N-1,A)
β+ and EC: (Z,N,A) -> (Z-1,N+1,A)
Decay Energy
The energy available for the decay is known as β decay Q-value. For transitions between nuclear ground states it is calculated as:
β- decay Q-value=Mass(Z,N) - Mass(Z+1,N-1)
β+ decay Q-value=Mass(Z,N) - Mass(Z-1,N+1)- 2×Mass(electron)
Electron Capture Q-value=Mass(Z,N) - Mass(Z-1,N+1)- Binding Energy(electron)
Numerical values can be obtained from the web application QCalc.
Chart Region
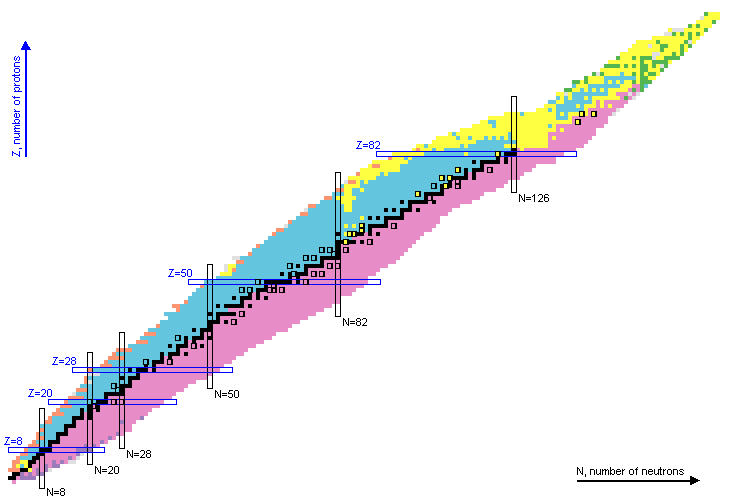
β- occurs for nucleus that have an excess of neutrons when compared to stable nuclei. In contrast, β+ decay and Electron Capture take place in nuclei with a deficiency of neutrons, that is, an excess of protons. Nuclei that exhibit β- decay are indicated with a pink background in the chart of nuclei, while a blue hue is used for those with β+/EC:
β decay half-lives are typically larger than 1 millisecond. The larger the energy available for the decay, the shorter the half-life. Additionally, nuclear levels with similar values of spin and parity to the initial level are preferentially populated. The larger the difference in angular momentum the larger the half-life.
β Decay Transitions
β decay transitions can be classified by the change in angular momentum and parity between the initial and final levels:
| Type | Angular Momentum Change | Parity Change |
| Allowed | 0,1 | No |
| 1st Forbidden non-unique | 0,1 | Yes |
| 1st Forbidden unique | 2 | Yes |
| 2nd Forbidden non-unique | 2 | No |
| 2nd Forbidden unique | 3 | No |
| 3rd Forbidden non-unique | 3 | Yes |
| 3rd Forbidden unique | 4 | Yes |
For each decay branch with decay probability I the Logft value is defined as:
Logft = log( f(Z,E0) T1/2 / I)
where T1/2 is the half-life, E0 is the end-point energy for the transition and f(Z,E0) is the Fermi integral. Logft values increase with increasing T1/2 and increasing E0 values, but decrease with increasing decay probability values.
The relation between the type of transition and its Logft value has been studied in detailed by Raman and Gove and Singh et al.
Logft values can be calculated using the web application Logft.
Additional Resources
Database Manager and Web Programming:
Alejandro A. Sonzogni
sonzogni@bnl.gov
Navigation