


Abstract
High-spin level structures in neutron-rich 141Xe nucleus have been reinvestigated by measuring the triple fold and four-fold γ coincidence data obtained in the spontaneous fission of 252Cf. Several new levels and transitions are identified. The previously proposed  octupole bands have been significatively updated and expanded. The systematic characteristics of the octupole deformation and octupole correlations are discussed. Reflection asymmetric shell model calculations for the
  octupole bands of 141Xe are in good agreement with the experimental data.
Export citation and abstract BibTeX RIS
1. Introduction
Theoretical calculations in the deformed shell model predicted the existence of octupole deformation and octupole correlations in the Z = 56 and N = 88 neutron-rich nuclear region [1–3]. In such a region, the level patterns were expected to include two sets of parity doublet bands characterized with simplex quantum numbers  for even–even nuclei and
  for odd-A nuclei [4]. In even–even nuclei, the spins and parities (
 's) of the levels are:
  for the s = +1 band, and
  for the s = −1 band. While in odd-A nuclei, they are:
  for the
  band, and
  for the
  band. So far, octupole deformed bands and octupole correlations were observed in many nuclei in this region, for examples, in Ba (Z = 56) [3, 5–10], La (Z = 57) [11] and Ce (Z = 58) [6, 12–19] isotopes. However, most of the observed octupole bands belong to single simplex with
  in even–even nuclei, or
  or
or  in odd-A nuclei. The two sets of parity doublet bands were only reported in a few nuclei, for example, in odd-A 143Ba (with
  ) [10] and in even–even 148Ce (with
  ) [17].
The neutron-rich Xe isotopes with Z = 54 are located in the Z = 56, N = 88 octupole deformed region. In a previous report, the  octupole band structures were identified in even–even
  Xe [20]. Then, in a recent paper, the
  octupole bands have been reported in 140Xe by our cooperation [21]. For the odd-A 141Xe, some levels and transitions with higher spins were firstly reported in [22]. Then, the
  octupole bands were proposed in a short note paper [23]. However, the octupole band structures in 141Xe still need to be studied and perfected in more details. In this paper, we reinvestigate the high-spin states in 141Xe. The octupole band structures are significantly updated and expanded. Reflection asymmetric shell model (RASM) calculations for the octupole bands in 141Xe were carried out.
2. Experiments and results
As the 141Xe is located at the A = 140 neutron-rich nuclear region, to study its high-spin states is difficult by using the usual heavy-ion fusion-evaporation reactions. An effective method is to measure the prompt γ rays of spontaneous fission or particle induced fission from heavy nuclei by using a large detector array [6]. The high-spin states of 141Xe in this work were studied by measuring the prompt γ rays from the 252Cf fission. The experiment was carried out at the Lawrence Berkeley National Laboratory. The Gammasphere detector array consisting of 101 Compton-suppressed Ge detectors was used to detect the γ rays. A total of 5.7 ×10¹¹ triple- and higher-fold γ events, and 1.9 ×10¹¹ four- and higher-fold γ coincident events were collected. A γ-γ-γ coincidence matrix (cube) and a γ-γ-γ-γ coincidence matrix (hypercube) were constructed. Detailed information of the experiment can be found in [6, 16, 24]. The coincidence data were analyzed with the Radware software package [25].
A new level scheme of 141Xe obtained from present work is shown in figure 1. Five collective band structures with  linking transitions inside each band are labeled on top of the bands with numbers (1)–(5). Most of the levels and transitions reported in [22, 23] are confirmed in this work. We add two new levels at 3925.7 and 4081.1 keV along with two new transitions of 818.1 and 715.5 keV in bands (1) and (2), respectively. A weak linking 299.1 keV transition between bands (1) and (2) is also tentatively added in the level scheme. In [23], band (3) was only identified with three levels at 35.7, 553.0 and 1030.5 keV along with two transitions of 517.3 and 477.5 keV, and was proposed to be based on the 35.7 keV level. In the present work, the 553.0 and 1030.5 keV levels along with the 477.5 keV transition in band (3) are confirmed, but the reported 517.3 keV transition between the 553.0 and 35.7 keV levels is not observed. Three new levels at 1546.8, 2153.8 and 2847.4 keV along with the new transitions of 516.3, 607.0 and 693.6 keV in this band are identified. According to present work, the 35.7 keV level does not belong to band (3). On the other hand, if the 35.7 keV level belongs to the bandhead level of band (3), the 517.3 keV level spacing from 11/2− to 7/2− states in the band is too large to meet the characteristics of a collective rotational band. Thus, the band (3) should be built on the 553.0 keV level instead of the 35.7 keV one reported in [23]. So the band (3) is significantly updated and expanded. The levels and transitions in band (4) reported in [23] are confirmed in this work. Besides, a new level at 3146.4 keV and a new transition of 569.3 keV are added to band (4).

Figure 1. The level scheme of 141Xe identified in this work. The ∗ denotes the levels and γ transitions newly identified in this work compared with those in [22, 23].
Download figure:
Standard image High-resolution imageIn addition, four new linking transitions, 548.4 and 473.6 keV between bands (1) and (3), and 427.9 and 423.3 keV between bands (3) and (4), are also observed. A side band (5) along with the linking transitions between band (1) and (5) are confirmed, and a new linking transition of 149.0 keV is also identified compared with those in [22]. A summary of the γ-transition energies, relative intensities, multipolarities, and spin and parity assignments in 141Xe are given in table 1. The γ-transition intensities have been normalized to that of the 370.0 keV γ ray.
As examples, figures 2 and 3 show some coincidence γ-ray spectra in 141Xe. In figure 2, by summing double gating on the 370.0 and 515.8 keV γ transitions, and the 370.0 and 681.8 keV γ transitions, the corresponding coincidence γ transitions in figure 1 can be seen. Figure 3(a) is generated by double gating on the 370.0 and 548.0 keV γ transitions. This spectrum should include the corresponding coincidence γ peaks generated by 370.0 and 547.9 keV γ gate mixed with the 370.0 and 548.4 keV γ gate. So one can see the 516.3 mixed with the 515.8 keV in band (1), 607.6 and 693.6 keV γ peaks in band (3), 478.8, 602.4 and 569.3 keV γ peaks in band (4), as well as the linking transitions, 465.4, 427.9 and 423.3 keV (mixed with the 422.9 keV γ peak of the 108Ru partner) between bands (3) and (4). Figure 3(b) is generated by triple gating on the 370.0, 515.8 and 548.4 keV γ transitions in the hypercube. As pointed out in [24], the spectrum from the hypercube has approximately a factor of 10 fewer events than the triple-coincidence cube, but the hypercube reduced the contamination and increased the peak to background ratio significantly. In this figure, one can see the 607.6 and weak 693.6 keV γ peaks in band (3), 602.4 and 569.3 keV γ peaks in band (4), as well as the linking transitions, 427.9 and 423.3 keV (mixed with the 422.9 keV γ peaks of the 108Ru partner) between bands (3) and (4). In these spectra, one can see some partner γ peaks, such as, 270.3 and 444.5 keV in 106Ru (5n) [26], 103.1, 108.8, 159.4, 199.9, 228.9 and 370.9 keV in 107Ru (4n) [27], 242.3, 422.9, 574.8, 701.7, 732.6 and 797.6 keV in 108Ru (3n) [28], and 96.4, 98.5, 172.7, 185.1 and 272.7 keV in 109Ru (2n) [29] (numbers in parentheses indicate the numbers of neutrons emitted after fission), in addition to the γ transitions observed in 141Xe.
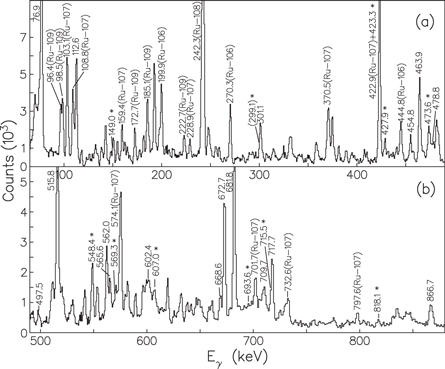
Figure 2. The γ-ray spectra obtained by summing double gating on the 370.0 and 515.8 keV γ transitions, and the 370.0 and 681.8 keV γ transitions in 141Xe. The range of the energy is (a) from 65 to 490 keV, and (b) from 490 to 880 keV. The * denotes the γ transitions newly identified in this work.
Download figure:
Standard image High-resolution image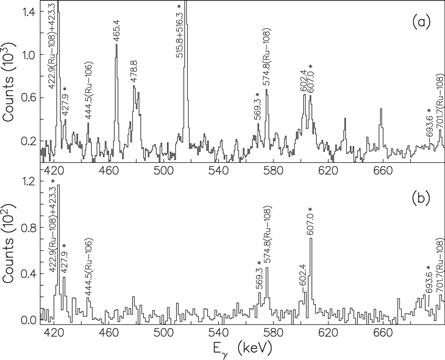
Figure 3. The γ-ray spectra in 141Xe by (a) double gating on the 370.0 and 547.9 keV γ transitions, and (b) by triple gating on the 370.0, 515.8 and 548.4 keV γ transitions. The * denotes the γ transitions newly identified in this work.
Download figure:
Standard image High-resolution imageIn the spontaneous fission of 252Cf, the fission yield of the 141Xe is lower than that in the neighboring isotope 140Xe reported in [21]. So some newly identified γ transitions at high spins, for examples, the 818.8, 715.5, 693.6 and 569.3 keV γ rays, are weak and some γ peaks are not shown very clearly in figure 2. In order to show clearer γ peaks, we give some partial coincidence γ-ray spectra as shown in figure 4. Figure 4(a) is generated by double gating on the 709.7 and 717.7 keV γ transitions. Beside the 681.8 keV γ peak, the newly identified 818.1 keV γ transition in band (1) can be clearly seen. In figure 4(b), by double gating on the 562.0 and 668.6 keV γ transitions, one can clearly see the new 715.5 keV γ peak in band (2), in addition to the 463.9, 515.8 and the 672.7 keV γ peaks. Figure 4(c) is generated by double gating on the 473.6 and 681.8 keV γ transitions. In addition to the 515.8 keV γ peak, the new 696.3 keV γ transition in band (3) can be clearly seen. In this spectrum, the other unmarked stronger γ peaks come from the background of other fission products. In figure 4(d), by double gating on the 465.4 and 478.8 keV γ transitions, one can also clearly see the new 569.3 keV γ peak in band (4), in addition to the 440.4, 477.5, 547.9 and 602.4 keV γ peaks. In this spectrum, the 517.3 keV γ peak (from 553.0 to 35.7 keV levels) reported in [20] cannot be seen. This gives evidence that the 35.7 keV (7/2−) level should not be a member of band (3), as discussed above.

Figure 4. The partial γ-ray spectra in 141Xe by (a) double gating on the 709.7 and 717.7 keV γ transitions, (b) by double gating on the 562.0 and 668.6 keV γ transitions, (c) by double gating on the 473.6 and 681.8 keV γ transitions, and (d) by double gating on the 465.4 and 478.8 keV γ transitions. The * denotes the γ transitions newly identified in this work.
Download figure:
Standard image High-resolution imageThe spins and parities ( 's) for some levels in 141Xe were assigned or tentatively assigned in [23]. That is, the bands (1) and (3) were assigned with the negative parity, and the bands (2) and (4) with the positive-parity. We agree with those assignments. The
  's for the new observed levels in this work are assigned or tentatively assigned based on the rotational band regularity and our angular correlation measurements for some cascade transitions. Thus, as suggested in [23], two sets of negative- and positive-parity bands (1) and (2), and bands (3) and (4) with
  transitions in each band and with linking E1 transitions between the positive- and negative-parity bands form
  octupole bands in 141Xe. Here we significantly updated and expanded them.
Table 1.
The energies, relative intensities, multipolarities, and spin and parity ( ) assignments of the γ-transitions and levels in 141Xe. The * denotes the γ transitions newly identified in this work.
| Eγ (keV) | Int. ( ) ) |
Ei (keV) → Ef (keV) | Assignment | Mult. |
|---|---|---|---|---|
| (35.7) | 35.7 → 0 | 7/2− → 5/2− |

|
|
| 76.9 | 75.3(7) | 112.6 → 35.7 | 9/2− → 7/2− |

|
| 112.6 | 21.9(4) | 112.6 → 0 | 9/2− → 5/2− | E2 |

|
0.6(2) | 2546.9 → 2397.9 | (25/2−) → (25/2−) |

|
| *(299.1) | (<0.1) | 2697.0 → 2397.9 | (27/2+) → (25/2−) |

|
| 301.1 | 3.1(1) | 1981.3 → 1680.2 | (21/2−) → 21/2− |

|
| 338.3 | 1.4(1) | 1671.1 → 1332.8 | 19/2+ → 15/2+ | E2 |
| 339.7 | 5.6(5) | 1495.9 → 1156.2 | 17/2+ → 13/2+ | E2 |
| 370.0 | 100.0 | 482.6 → 112.6 | 13/2− → 9/2− | E2 |

|
<0.5 | 2577.1 → 2153.8 | (25/2+) → (23/2−) |

|

|
1.0(1) | 1974.7 → 1546.8 | (21/2+) → 19/2− |

|
| 440.4 | 11.6(5) | 553.0 → 112.6 | 11/2− → 9/2− |

|
| 454.8 | 1.9(1) | 2135.0 → 1680.2 | 23/2+ → 21/2− | E1 |
| 463.9 | 8.6(2) | 2135.0 → 1671.1 | 23/2+ → 19/2+ | E2 |
| 465.4 | 5.3(3) | 1495.9 → 1030.5 | 17/2+ → 15/2− | E1 |

|
2.3(1) | 2153.8 → 1680.2 | (23/2−) → 21/2− |

|
| 477.5 | 5.3(3) | 1030.5 → 553.0 | 15/2− → 11/2− | E2 |
| 478.8 | 4.0(2) | 1974.7 → 1495.9 | (21/2+) → 17/2+ |

|
| 497.5 | 0.8(1) | 1495.9 → 998.4 | 17/2+ → 17/2− | E1 |
| 515.8 | 62.5(11) | 998.4 → 482.6 | 17/2− → 13/2− | E2 |

|
0.9(1) | 1546.8 → 1030.5 | 19/2− → 15/2− | E2 |
| 547.9 | 8.4(3) | 1030.5 → 482.6 | 15/2− → 13/2− |

|

|
4.9(1) | 1546.8 → 998.4 | 19/2− → 17/2− |

|
| 562.0 | 4.9(1) | 2697.0 → 2135.0 | (27/2+) → 23/2+ |

|
| 565.6 | 1.2(1) | 2546.9 → 1981.3 | (25/2−) → (21/2−) |

|

|
0.8(1) | 3146.4 → 2577.1 | (29/2+) → (25/2+) |

|
| 602.4 | 2.5(2) | 2577.1 → 1974.7 | (25/2+) → (21/2+) |

|
| 603.2 | 4.6(4) | 1156.2 → 553.0 | 13/2+ → 11/2− | E1 |

|
1.8(1) | 2153.8 → 1546.8 | (23/2−) → 19/2− |

|
| 668.6 | 2.3(1) | 3365.6 → 2697.0 | (31/2+) → (27/2+) |

|
| 672.7 | 10.9(2) | 1671.1 → 998.4 | 19/2+ → 17/2− | E1 |
| 673.6 | 3.4(2) | 1156.2 → 482.6 | 13/2+ → 13/2− | E1 |
| 681.8 | 16.0(4) | 1680.2 → 998.4 | 21/2− → 17/2− | E2 |

|
0.7(1) | 2847.4 → 2153.8 | (27/2−) → (23/2−) |

|
| 709.7 | 2.1(1) | 3107.6 → 2397.9 | (29/2−) → (25/2−) |

|

|
0.8(1) | 4081.1 → 3365.6 | (35/2+) → (31/2+) |

|
| 717.7 | 4.1(1) | 2397.9 → 1680.2 | (25/2−) → 21/2− |

|

|
0.5(1) | 3925.7 → 3107.6 | (33/2−) → (29/2−) |

|
| 850.2 | 5.5(2) | 1332.8 → 482.6 | 15/2+ → 13/2− | E1 |
| 866.7 | 1.1(1) | 2546.9 → 1680.2 | (25/2−) → 21/2− |

|
To confirm the  's assignments, we have carried out the
  angular correlation measurements by dividing the data set into angular bins [30]. Here we only obtained several angular correlation values in 141Xe because most of the non-yrast transitions in 141Xe are very weak. As an example, figure 5 shows the experimental angular correlation curve for the
  keV cascade. The obtained A2 and A4 values are 0.098(63) and −0.027(95), respectively, and yield for the
  cascade with a mixing ratio
  (see table 2). Our experimental
  results and extracted δ values for some cascade and comparison with theoretical calculated values by using the program in [31] are given in table 2. These data offer further support for the
  assignments of 141Xe in the present work.
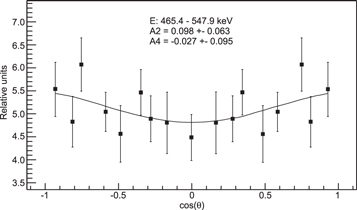
Figure 5. Angular correlations for  cascade in 140Xe.
Download figure:
Standard image High-resolution imageTable 2.
Angular correlations for some cascade transitions and the spin and parity assignments for the levels as well as the mixing ratios for some  transitions in 141Xe.
| Cascade (keV) |

|

|

|

|

|
Assignment |
|---|---|---|---|---|---|---|
| 672.7 − 515.8 | −0.051(18) | −0.009(28) | −0.071 | 0.000 |

|
|
| 463.9 − 672.7 | −0.085(18) | −0.035(28) | −0.071 | 0.000 |

|
|
| 603.2 − 440.4 | 0.007(91) | 0.197(139) | 0.007 | 0.000 | 0.13 |

|
| 465.4 − 547.9 | 0.098(63) | −0.027(95) | 0.098 | 0.000 | −0.15 |

|
| 548.4 − 515.8 | 0.041(38) | 0.064(57) | 0.043 | 0.045 | 0.19 |

|
3. Discussion
Now we discuss the characteristics of the octupole deformation and octupole correlations in 141Xe. Figure 6 presents the systematic level comparison of the observed octupole bands in 141Xe with those in 140Xe [21] and 143Ba [10]. One can see that they exhibit very similar level energies. These data support the  octupole band assignments in 141Xe.

Figure 6. The systematic comparison for the levels of the octupole bands in 140Xe [21], 141Xe and 143Ba [10].
Download figure:
Standard image High-resolution imageThe energy differences  between the positive- and negative-parity bands in an octupole band can be used to discuss the stability of octupole deformation and octupole correlations with spin variation. Such
  values can be obtained from the experimental level energies by using the relation [17, 18]

Here the superscripts indicate the parities of the levels. Figure 7 shows plots of the  versus I of the
  octupole bands in 140Xe [21],
  octupole bands in 141Xe (present work) and 143Ba [10], respectively. In the limit of stable octupole deformation,
  should be close to zero. As seen in figure 7, the
  decreases with the spin increasing in each octupole band. It is close to the stable point at
  for
for  band in 140Xe, 13
  for
for  band in 141Xe, and 9
  and 11
  for
for  bands in 143Ba, respectively. However, for
  band in 140Xe and
  band in 141Xe, they do not reach the stable points until spin up to 17
  and 25/2
  , respectively. These results show that the octupole deformation and octupole correlations in
  Xe are more unstable than those in 143Ba.

Figure 7. The comparison for  versus spin I for
  octupole bands in 140Xe [21],
  octupole bands in 141Xe and 143Ba.
Download figure:
Standard image High-resolution imageIn a nuclear octupole band, the  branching ratios can be obtained by using the relation [17, 18, 21]:

where the intensities ( ) and energies (Eγ) in 141Xe are taken from this work. The calculated values for s =
  octupole bands in 141Xe from our data are listed in table 3. In [23], only one
  branching ratio was given in 141Xe, that is,
  from the 1671 keV level decay, which is consistent with our result of
  . The average
  value for
  octupole bands in 141Xe from our work is
  , while the average values are 0.78 and
  in 143Ba and 145Ba [10], and
  in 140Xe [21], respectively. This shows that the observed octupole correlations in 141Xe are rather weaker than those in
  Ba and 140Xe.
Table 3.
Calculated  branching ratios in 141Xe.
| s | Eγ (keV) |

|
Iγ |
 ( ( ) ) |
|---|---|---|---|---|

|
672.7 |

|
10.9(2) | 0.087(6) |
| 338.3 |

|
1.4(1) | ||
| 454.8 |

|
1.9(1) | 0.039(2) | |
| 463.9 |

|
8.6(2) | ||

|
465.4 |

|
5.3(3) | 0.033(3) |
| 339.7 |

|
5.6(5)) | ||
| 427.9 |

|
1.0(1) | 0.060(7) | |
| 478.8 |

|
4.0(2) | ||
To understand the characteristics of the octupole deformation and octupole correlations in 141Xe, we have carried out RASM calculations. Recently, this model has been successfully adapted to describe the octupole deformation and octupole correlations in the 143Ba [32], 145Ba [33] and 147Ce [16] in the Z = 56, N = 88 region. The details about RASM can be found in [32, 33]. For 141Xe, the deformation parameters used in the calculations are as follows:  and
and  , which are close to the values presented in [34]. For the
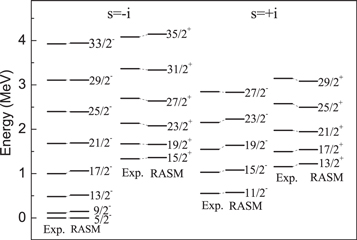
  octupole bands in 141Xe, the calculated results and comparison with the experimental data are shown in figure 8. One can see that up to medium spin states, the excitation energies of levels of 141Xe are well reproduced by the RASM calculations. But we notice that before the last level, several levels calculated are systematically slightly lower than the experimental ones in band (2) or higher than those in band (3), while the last one usually reverses slightly this pattern. The reason may be that the 141Xe nucleus has a weak deformation. In such a case, the deformations are generally soft and largely vary with an increasing angular momentum, especially after the backbending. The calculation with a fixed shape here may not be suitable at high spins. This needs to be improved further. The calculations indicate that both the
  octupole bands in 141Xe originate from the
 ![$\nu {h}_{9/2}[530]1/2(K=1/2)$](https://content.cld.iop.org/journals/0954-3899/44/9/095101/revision2/jpgaa8318ieqn137.gif) mixed with
mixed with ![$\nu {f}_{7/2}[532]3/2(K=3/2)$](https://content.cld.iop.org/journals/0954-3899/44/9/095101/revision2/jpgaa8318ieqn138.gif) configuration. So the bandhead of the ground state in 141Xe originates from the
configuration. So the bandhead of the ground state in 141Xe originates from the ![$\nu {h}_{9/2}[530]1/2(K=1/2)$](https://content.cld.iop.org/journals/0954-3899/44/9/095101/revision2/jpgaa8318ieqn139.gif) mixed with
mixed with ![$\nu {f}_{7/2}[532]3/2(K=3/2)$](https://content.cld.iop.org/journals/0954-3899/44/9/095101/revision2/jpgaa8318ieqn140.gif) configuration, but the origin of the 35.7 keV (
configuration, but the origin of the 35.7 keV ( ) level is not known, which needs to be further studied.
Figure 8. Comparison of the level energies by the RASM calculations for  octupole bands in 141Xe with experimental data.
Download figure:
Standard image High-resolution image
The characteristics for the side band (5) in 141Xe are not clear. Based on the transition patterns, we tentatively assigned the  's of the 1981.3 and 2546.9 keV levels in band (5) as
  and
and  , respectively. This band may originate from a three quasi-particle configuration, and more work is needed to understand it.
4. Summary
The high-spin band structures of neutron-rich 141Xe have been reinvestigated. The  octupole band structures have been confirmed and significantly expanded. Observed
  branching ratios indicate that the octupole correlations in 141Xe are rather weak. The systematic characteristics of the octupole deformation and octupole correlations have been discussed. RASM calculations for the
  octupole bands of 141Xe are in good agreement with the experimental data.
Acknowledgments
The work at Tsinghua University, China Institute of Atomic Energy was supported by the National Natural Science Foundation of China under Grants No. 11175095, No. 11205246 and No. 11375094. The work at Vanderbilt University, Lawrence Berkeley National Laboratory was supported, respectively, by US Department of Energy under Grant and Contract No. DE-FG05-88ER40407 and DE-AC03-76SF0098. The work at JINR was supported by the Russian Foundation for Basic Research Grant No.08-02-00089 and by the INTAS Grant No.2003-51-4496.