
Abstract
Berkelium isotopes have been produced in 11B-induced reaction on 238U. The EC decay of 244Bk → 244Cm has been studied by carrying out the single and coincidence measurements of the γ-rays emitted during the de-excitation of the 244Cm levels. Radiochemical separations have been carried out to minimize the contribution from the fission products and target. The new half-life of 244Bk is obtained as 5.02 ± 0.03 h, which is close to the theoretically calculated value. The relative intensities of the decay γ-rays have been re-evaluated. Based on the coincidence measurements, a tentative partial level scheme for 244Bk → 244Cm decay has been proposed.
Export citation and abstract BibTeX RIS
1. Introduction
Information about the decay data of heavier actinides is important for their identification and quantification. The decay properties of these heavy actinides are important from a nuclear structure point of view as well as to understand the competition between the various decay modes in nuclei that have a large Coulomb repulsion. In spite of exhaustive studies in this area, the decay data of neutron deficient heavier actinides are scarce in literature [1]. One of the major limiting factors for this is the production of these nuclides in measurable quantities. The production of these nuclides in bulk amounts is limited by the large fission cross section compared to the evaporation in this mass region. Therefore, the study of these actinides makes it necessary to have a mass separator [2–4] or to adopt suitable chemical procedures [5–8] to minimize the contribution from the radioactivity of the fission products and target material.
One such example is berkelium, the element with Z = 97 that was discovered by Thompson et al [9]. For many neutron deficient isotopes of berkelium, the decay data are limited in the literature [1]. For example, the EC-decay of 244Bk was first studied by Chetham–Strode et al [10]. The half-life for the 244Bk decay was reported as 4.35 ± 0.15 h. This nuclide was further studied by Ahmad et al by measuring the α-γ coincidence, the single γ-rays and the conversion electrons [11]. Two groups of α particles of energy, 6.666 ± 0.004 and 6.624 ± 0.004 MeV, were measured, and 26 γ-transitions following the EC decay of 244Bk were identified. The α/EC branching ratio was reported as (6 ± 2) × 10−5. The intensities of the decay γ-rays relative to 217.3 keV were reported. However, these γ-lines were not placed in the level scheme of the daughter nucleus, 244Cm [1, 12].
With an objective to get more information about the EC-decay of 244Bk and the level scheme of the daughter nucleus, 244Cm, berkelium isotopes were prepared by 11B + 238U reaction. The berkelium fraction was radiochemically separated from the target and the rest of the fission products in order to study the decay of 244Bk. The decay profile was followed for a few intense γ-lines to arrive at the half-life of 244Bk. The γ-ray intensities were re-determined relative to the 217.3 keV γ-ray of 244Bk. The coincidence measurements were carried out to obtain information about the level scheme of 244Cm.
2. Experimental details
2.1. Irradiation
The berkelium isotopes were produced by bombarding rolled metal foils of natural uranium (∼30 mg cm−2 in thickness) with 63.6 MeV 11B5+ beam from the BARC-TIFR Pelletron facility. Each irradiation was carried out for about ∼16 h to maximize the production of 244Bk. The beam energy was optimized using EMPIRE II code [13] to get the maximum cross section for 244Bk. However, even at this energy, the predicted fission cross section is about 500 times higher than the formation cross section of the evaporation residues. Figure 1(a) shows the γ-ray spectrum of the target after irradiation. It can clearly be seen that it was not possible to directly measure the γ-rays of the Bk isotopes owing to the presence of a large contribution of γ-rays from the fission products. The presence of the uranium x-rays and γ-rays further complicated the situation. Therefore, the removal of the target and fission products was necessary to study the small amount of Bk isotopes present in the target foil. Radiochemical separation based on ion exchange and solvent extraction was employed for the removal of the majority of the fission products and the uranium.
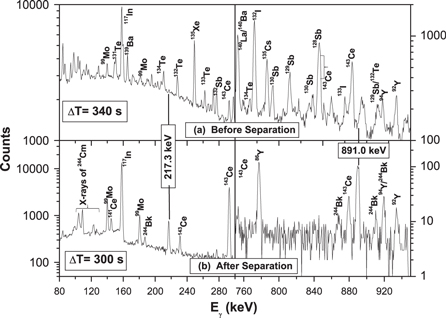
Figure 1. Comparison of the γ-ray spectra of the sample before and after chemical separation. The respective counting times are marked. The separation time was nearly 3 h.
Download figure:
Standard image High-resolution image2.2. Radiochemical separation
After irradiation, the uranium target was dissolved in 10 M HNO3. A few drops of concentrated HCl was added to facilitate the dissolution. The solution was dried and brought into 8 M HNO3. The solution was loaded onto an anion exchanger Dowex 1 × 8 column and eluted with 8 M HNO3. Uranium and some of the fission products were retained in the column. Under these conditions, the Bk isotopes were not retained in the column. The Bk fraction, along with some fission products, was collected and conditioned to 10 M HNO3. KBrO3 (equivalent to 0.5 M solution) was added to this aqueous phase, and the Ce-Bk fraction was extracted with two contacts of organic phase containing 0.15 M HDEHP (diethylhexylphosphoric acid) in dodecane. The Ce-Bk fraction was back-extracted from the organic phase with 1.5 M H2O2 in 8 M HNO3. The aqueous phase containing the Bk fraction, along with Ce and a few other fission products, was assayed by γ-spectrometry using HPGe detectors. The average duration for the entire separation procedure was nearly 3 h.
2.3. Gamma-ray spectrometry: singles and coincidence measurement
A detection system comprised of three HPGe single-crystal detectors was set up for the singles and coincidence measurement of the γ-rays. All of the three HPGe detectors had a relative efficiency of about ∼30%. A graded shielding, comprised of lead, copper, aluminum and Perspex sheets stacked together one after the other with the lead on the outermost side and the Perspex sheets closest to the detector, was used to minimize the natural γ-ray background for each of the HPGe detectors. The energy and efficiency calibrations of the γ-ray detectors were carried out in the energy range of 121.8–1408 keV with standard γ-ray sources of 152Eug and 133Bag, each of which had a volume of 5 mL. The dead time for the singles measurement was reduced from nearly 50% to about 1% after the radiochemical separation, which substantially improved the relative contribution as well as the peak to total ratios of the γ-rays from the Bk isotopes. The volume of the final solution used for counting was kept as 5 mL. The γ-ray spectrum of the sample after the chemical separation is shown in figure 1(b). It can be seen from this figure that the 217.3 keV γ-ray of 244Bk, which was barely visible before the chemical separation, becomes one of the dominant peaks below the 300 keV region. After separation, a typical count rate of the 217.3 keV γ-ray was around ∼16 cps. Also, the 891.0 keV γ-ray of 244Bk, which was not even visible before the chemical separation, can be clearly seen in the γ-ray spectrum.
3. Results and discussion
3.1. Determination of half-life and γ-ray intensities
The singles spectra were analyzed using the peak area analysis software PHAST [14]. In the γ-ray spectra, the γ-ray energies from 244Bk were the most prominent ones among the different Bk isotopes that were produced. The three most intense γ-lines of 244Bk are 217.3 ± 0.3 keV, 187.4 ± 0.3 keV and 891.0 ± 0.4 keV. In the present work, the half-life of 244Bk was determined using the decay profile of these three γ-ray energies.
The activity of a γ-ray decaying with decay constant λ (= 0.693/T1/2) at any time Tcool can be written as:

where PA is the area under the peak of a given γ-ray energy that has intensity aγ and detection efficiency  γ; A0 is the initial activity (at time T = 0, which corresponds to the end of irradiation), CT is the real time and LT is the live time of the detection system. So, the measured activity of a given γ-ray as a function of the cooling time was fitted using a nonlinear least square fitting program with two free parameters, namely λ and (A0aγ).
Figure 2 shows the decay of the three γ-lines (217.3 keV, 187.4 keV and 891.0 keV). The half-life of 244Bk has been obtained as 5.07 ± 0.04 h, 5.00 ± 0.13 h and 4.98 ± 0.04 h from the 217.3 keV, 187.4 keV and 891.0 keV γ-rays, respectively. The uncertainties quoted on the half-lives are the fitting errors. The half-life of 244Bk as obtained from the error weighted mean of the above three values is 5.02 ± 0.03 h. This is significantly larger compared to the value of 4.35 ± 0.15 h, as reported earlier in the literature [1, 10]. The newly obtained half-life is closer to the theoretically predicted half-life of 4.78 h [15].

Figure 2. Decay profile of 217.3, 187.4 and 891.0 keV γ-rays. The fitted curve is shown by solid lines.
Download figure:
Standard image High-resolution imageIn order to determine the relative intensities of the γ-rays of 244Bk, γ-ray spectra at different time intervals (acquired for a total duration of about 12 h) were added to improve the statistics. In the summed spectrum, most of the previously reported [1] γ-rays of 244Bk were identified. The re-determined γ-ray energies, along with the energies reported in the literature, are presented in table 1. The uncertainties on the γ-ray energies were due to the variations seen in the singles and coincidence spectra. It can be seen from the table that the uncertainties on the γ-ray energies have been significantly improved in the present data set. It is noteworthy that the differences in the γ-ray energies compared to the values reported earlier were as high as 2–3 keV for some of the γ-rays. In the present work, the peak areas of the γ-ray energies in the sum spectrum were efficiency corrected to determine their intensities relative to the 217.4 keV γ-ray. The relative intensities of the γ-rays thus obtained in the present work, along with the literature values [1], have been listed in table 1. The uncertainties on the relative intensity values are due to counting statistics and efficiency fitting errors. It is evident from table 1 that the relative intensities of the γ-rays, as obtained in the present work, are close to the values reported earlier for several γ-rays. However, significant deviations are also equally abundant. It can also be seen from table 1 that the uncertainties on the relative intensities have now been significantly reduced compared to the values reported earlier [1]. In addition, a few new γ-rays have been assigned to the 244Bk decay scheme based on the coincidence data analysis (described in the next section). Their energies and relative intensities obtained from the sum spectrum are also reported in table 1. In the sum spectrum, it was not possible to resolve a few closely spaced γ-ray energies, which were clearly distinguished in the coincidence data analysis. For such cases, the intensities are quoted for the combined γ-ray energies, as reported in table 1. The relative intensity obtained for the 489.8 keV γ-ray has been corrected for the contribution from 143Ce. Two of the γ-ray energies, 144.5 and 745 keV, could not be seen in the singles spectra owing to the overwhelmingly large count rate from the 99Mo γ-rays of nearby energies. Also, the 1141 keV γ-ray, which was reported earlier as a γ-ray of 244Bk [1], was not seen in the singles and coincidence spectra.
Table 1. Energies and relative intensities of the γ-rays as obtained in the present measurement. The initial and final energy levels associated with the de-exciting transition are also listed. The results have been compared with the values reported earlier in the literature [6]. The transition levels marked '*' are adopted from the literature [6].
| Literature | Experimental | Transition levels | |||
|---|---|---|---|---|---|
| Energy (MeV) | Relative Intensity (%) | Energy (MeV) | Relative Intensity (%) | From | To |
| 144.5 ± 0.3 | 7.4 ± 0.7 | 144.6 ± 0.2 | Not seen in the summed spectrum due to the large count rate of 140 keV | 1295.6 | 1151.0 |
| 154.0 ± 0.3 | 3.7 ± 0.4 | 153.5 ± 0.2 | 5.4 ± 0.8 | Not placed | |
| 175.4 | Not seen in the summed spectrum | Not placed | |||
| 177.0 ± 0.3 | 4.2 ± 0.5 | 176.7 ± 0.2 | 4.1 ± 0.4 | 1327.7 | 1151.0 |
| 187.6 ± 0.3 | 16.5 ± 1.5 | 187.4 ± 0.3 | 16.5 ± 0.5 | 1151.0 | 963.8 |
| 217.6 ± 0.3 | 100 | 217.3 ± 0.3 | 100 | 1151.0 | 934.0 |
| 233.8 ± 0.4 | 2.9 ± 0.4 | 233.7 ± 0.2 | 1.8 ± 0.2 | Not placed | |
| 333.5 ± 0.5 | 10.0 ± 1.5 | 334.2 ± 0.5 | 11.3 ± 0.4 | Not placed | |
| 335.5 ± 0.1 | |||||
| 411.5 ± 0.3 | 4.0 ± 0.2 | Not placed | |||
| 433.2 ± 0.2 | 3.5 ± 0.3 | Not placed | |||
| 470.3 ± 0.6 | 3.0 ± 0.2 | Not Placed | |||
| 490.5 ± 0.5 | 18 ± 2 | 489.8 ± 0.4 | 14.0 ± 0.6 | 1785.4 | 1295.6 |
| 565.2 ± 0.2 | 1.8 ± 0.3 | 1785.4 | 1220.2 | ||
| 569.3 ± 0.7 | 1.6 ± 0.3 | Not placed | |||
| 607.4 ± 0.7 | 2.9 ± 0.3 | Not placed | |||
| 609.2 ± 0.2 | 3.3 ± 0.3 | Not placed | |||
| 617.7 ± 0.3 | 4.4 ± 0.2 | Not placed | |||
| 616.1 | Not seen in the summed spectrum | Not placed | |||
| 625.3 ± 0.4 | 1.3 ± 0.2 | Not placed | |||
| 642.6 ± 0.4 | 1.8 ± 0.3 | Not placed | |||
| 690.7 ± 0.3 | 0.4 ± 0.2 | 1654.5 | 963.8 | ||
| 745 ± 1 | 8 ± 1 | Not seen in the summed spectrum due to the large count rate of 740 keV | Not placed | ||
| 846.7 ± 0.1 | 1.0 ± 0.2 | Not placed | |||
| 870 ± 1 | 7 ± 1 | 869.5 ± 0.9 | 5.6 ± 0.3 | Not placed | |
| 891.5 ± 1.0 | 114 ± 12 | 891.0 ± 0.4 | 106.1 ± 3.7 | 934.0 | 43.0* |
| 910 ± 1 | 3.0 ± 0.5 | 909.1 ± 0.4 | 3.0 ± 0.2 | Not placed | |
| 921.5 ± 1.0 | 22 ± 3 | 920.8 ± 0.5 | 23.8 ± 0.9 | 963.8 | 43.0* |
| 988 ± 1 | 5 ± 1 | 985.9 ± 0.8 | 2.5 ± 1.1 | Not placed | |
| 995.6 | Not seen in the summed spectrum | Not placed | |||
| 999.4 ± 0.5 | 1.4 ± 0.2 | Not placed | |||
| 1014.6 | Not seen in the summed spectrum | Not placed | |||
| 1042 ± 2 | ≈3 | 1040.9 ± 0.4 | 2.1 ± 0.2 | Not placed | |
| 1107.6 ± 0.5 | 2.4 ± 0.1 | 1151.0 | 43.0* | ||
| 1136 ± 2 | ≈1.5 | 1138.0 ± 0.5 | 2.0 ± 0.2 | Not placed | |
| 1141 ± 2 | ≈2 | Not observed in the present work | Not placed | ||
| 1153 ± 1 | 9.5 ± 1.4 | 1153.4 ± 0.6 | 9.9 ± 0.3 | 1295.6 | 142.3* |
| 1173 ± 2 | ≈0.7 | 1173.1 ± 0.5 | 1.0 ± 0.1 | Not placed | |
| 1178 ± 1 | 5.0 ± 0.8 | 1177.2 ± 0.1 | 3.9 ± 0.2 | 1220.2 | 43.0* |
| 1205 ± 2 | ≈1 | 1205.3 ± 0.5 | 1.3 ± 0.1 | Not placed | |
| 1211 ± 2 | ≈1.3 | 1211.9 ± 0.7 | 1.3 ± 0.1 | Not placed | |
| 1233 ± 1 | 4.0 ± 0.8 | 1232.7 ± 0.7 | 1.5 ± 0.4 | Not placed | |
| 1252 ± 1 | 3.0 ± 0.6 | 1252.5 ± 0.7 | 2.7 ± 0.1 | 1295.6 | 43.0* |
| 1333 ± 1 | 1.2 ± 0.4 | 1331.6 ± 0.6 | 2.1 ± 0.1 | Not placed | |
| 1505 ± 5 | ≈3 | 1502.3 ± 0.7 | 1.2 ± 0.1 | Not placed | |
3.2. Determination of a level scheme from the γ-γ coincidence measurement
The offline analysis of the experimental coincidence data was done using the RADWARE software package [16, 17]. The acquired data after presorting (i.e. the energy calibration followed by the software gain matching over the entire energy range), were sorted into a conventional γ–γ coincidence matrix. The matrix was then used to determine the correlation between the two coincident γ-rays. A typical γ-ray spectrum gated with the 217.3 keV γ-ray is shown in figure 3. Various decay γ-rays of 244Bk and the x-rays of the daughter product, 244Cm, are marked in the figure. As seen from the figure, the x-ray peaks are the most dominant. Also, the absence of the most intense γ-ray peaks of the singles spectra in the gated spectrum indicates that the contributions from the chance coincidence are negligibly small.

Figure 3. Representative gated γ-ray spectrum of 244Bk, which shows the coincident gamma rays with 217 ± 1 keV.
Download figure:
Standard image High-resolution imageIn a twofold coincidence requirement, it may be possible that γ-rays from some other products may wrongly be assigned to 244Bk if they emit γ-rays with energies close to any of the γ-rays of 244Bk. In order to unambiguously identify the γ-rays of 244Bk, an additional condition was imposed, which is as follows: either the γ-ray should be present in the spectra gated by the x-rays of Cm or when gated with a particular γ-ray energy; the x-rays of Cm should be present in the spectrum. The second condition was required to identify weak γ-rays in the low energy region. These γ-rays may be missed while gating with the x-rays due to the large Compton background present in the low energy region. However, it should be mentioned here that if a γ-ray is not in coincidence with any of the γ-rays that belong to one of the cascades that contains 187.4, 217.3 or 891.0 keV (for which half-lives have been measured) as members, the possibility of its origin from the neighboring Bk isotopes, like 243Bk and 245Bk, cannot be completely ruled out. The energy of such γ-rays were 334.2, 985.9, 1040.9, 1136, 1177.2, 1205.3, 1232.7 and 1502.3 keV. However, none of these were of the same energy as any of the known γ-rays of 245Bk (T1/2 = 4.94 days) or 243Bk (T1/2 = 4.5 h). Also, the observed count rates of the known γ-rays of 243,245Bk were very low in the summed spectrum, and none of the above listed γ-rays were in coincidence with any known γ-rays of 243/245Bk. Therefore, their possible origins from either of these two neighboring isotopes were ruled out.
Thus, in the present work, a γ-ray has been assigned to the decay scheme of 244Bk if it satisfies one of the following conditions:
- (i)it follows the half-life of 244Bk;
- (ii)it is in coincidence with a γ-line that follows the half-life of 244Bk;
- (iii)it is in coincidence with any of the γ-lines that belongs to the cascade that has the γ-line that follows the half-life of 244Bk;
- (iv)it is in coincidence with the previously reported γ-lines [6].
The coincident γ-rays of 244Bk are listed in table 2. The γ-ray energy in the second column indicates the gated γ-ray (Eγ ± 1 keV), and the γ-rays in coincidence with the gated γ-ray are listed in the third column. Based on the statistics, the coincidences have been categorized as strong (>50 counts) or weak (<50 counts). Strong coincidences have been marked as bold letters in the table.
Table 2. List of γ-rays in coincidence with the γ-rays of 244Bk. The gate is Eγ ± 1 keV. The strong coincidences (>50 counts) are marked as bold. The γ-lines that could not be placed unambiguously in the decay scheme are underlined.
| S. No. | Gated gamma-ray (Eγ) | Coincidence gamma-ray energies |
|---|---|---|
| 1. | 74.9 | 144.6, 187.4, 217.3, 335.5, 489.8, 891.0, 920.8, 999.3, 1153.4 |
| 2. | 187.4 | 144.6, 176.7, 411.5, 489.8, 846.7, 869.5, 891.0, 920.8 |
| 3. | 217.3 | 144.6, 176.7, 411.5, 433.0, 489.8, 569.3, 846.7, 891.0, 995.6, 999.3, 1014.6 |
| 4. | 334.2 | 219.7, 411.5, 489.8 |
| 5. | 411.5 | 187.4, 217.3, 334.2, 891.0, 920.8, 1153.4 |
| 6. | 489.8 | 144.6, 175.4, 187.4, 217.3, 334.2, 891.0, 920.8, 1153.4, 1232.7, 1252.5 |
| 7. | 607.4 | 217.3, 617.7, 985.9, 1177.2 |
| 8. | 616.1 | 187.4, 217.3, 607.4, 985.9 |
| 9. | 869.5 | 187.4, 217.3, 489.8, 625.7, 642.6 |
| 10. | 891.0 | 144.6, 176.7, 187.4, 217.3, 411.5, 431.3, 489.8, 569.2 |
| 11. | 920.8 | 144.6, 176.7, 187.4, 233.7, 411.5, 489.8, 690.7 |
| 12. | 985.9 | 607.4, 616.1 |
| 13. | 999.3 | 217.3 |
| 14. | 1040.9 | 470.3 |
| 15. | 1107.6 | 176.7, 489.8 |
| 16. | 1153.4 | 100, 411.5, 489.8 |
| 17. | 1177.2 | 153.5, 565.2, 609.3 |
| 18. | 1232.7 | 489.8 |
| 19. | 1252.5 | 489.8 |
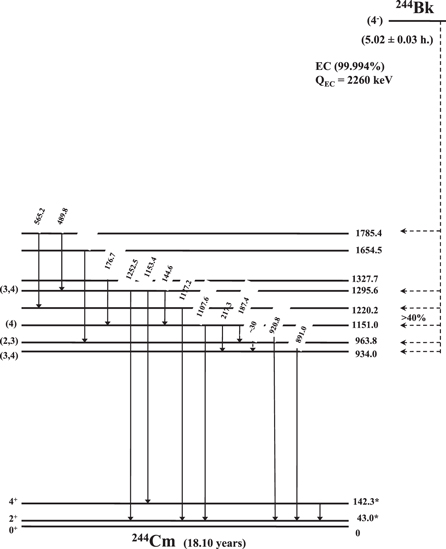
Based on the Nilsson single-particle level scheme, two possible values for the ground state spin of 244Bk have been proposed [18]. The assignment given by Sood et al is (1−) (3/2−[521]π ⨂ 1/2+[631]ν) and that given in the ENSDF table is (4−) (3/2−[521]π ⨂ 5/2+[622]ν) [18]. If the ground state spin of 244Bk is assumed to be 1−, then the majority of the EC decay should have directly fed the ground state (Iπ = 0+) and the 43.0 keV (Iπ = 2+) levels of 244Cm. The observation of several strong γ-rays and the absence of the 942 keV γ-ray (reported for 244Am (1+) → 244Cm decay) suggest the ground state spin of 244Bk to be 4− rather than 1−. The strongest coincidence was observed between the 217.4 and 891.0 keV γ-ray energies (∼3700 counts). Also, the 187.4 and 920.8 keV transitions showed a coincidence count of ∼480. The energy summing indicates that the origin of these two cascades is from the same level (Ex = 1108.3 + x keV). This level de-excites to 920.8 + x and 891.0 + x keV levels by emitting 187.4 and 217.3 keV γ-rays, respectively. The large coincidence counts and relative intensities of the γ-rays suggest a large direct feeding to the 1108.3 + x keV level of 244Cm by the EC-decay of the 244Bk. Based on this, the 1108.3 + x keV level was assigned a tentative spin of '4,' as this level has the largest direct feeding by EC-decay of the 244Bk. Also, a transition of 1107.6 keV was observed, which was assumed to originate from the 1108.3 + x keV level. Due to the large spin value of the 1108.3 + x keV level, it is not expected to directly de-excite to the ground state, i.e. x is not equal to zero. As the 1107.6 keV transition was very weak, it was not likely to decay to the 142.3 keV (Iπ = 4+) state; rather, it should be a transition to the 43.0 keV (Iπ = 2+) state. Based on this, the proposed value of 'x' is 43.0 keV. However, the transition from 43.0 to the ground state could not be detected in the present experiment due to the higher energy thresholds of the timing circuit.
Based on the above discussion, the 1151.0 keV level was added to the level scheme of the 244Cm. The de-excitation of the 1151.0 keV level to 934.0 keV levels with maximum intensity indicates that the tentative spin of the 934.0 keV level could be 3 or 4. Another transition of 187.4 keV from the 1151.0 keV level to the 963.8 keV level has a relative intensity of about 16.5%, which indicates the spin of this level to be 2 or 3. The difference in the intensities of the two transitions suggests different multipolarities arising from the difference in the spin/parity values of the levels involved. Based on this discussion and the relative transition intensities, tentative spins of (3, 4) and (2, 3) were assigned to the 934.0 and 963.8 keV levels, respectively. The coincidence between 187.4 keV and 891.0 keV requires that the levels at 963.8 and 934.0 keV are linked. It is assumed that they are linked through a low energy transition (∼30 keV), which could not be detected in the present measurement.
The 1295.6 keV level de-excites to the 1151.0 keV level by emitting a 144.6 keV γ-ray and to the 142.3 keV (Iπ = 4+) level with the emission of the 1153.4 keV γ-ray. Also, there is a direct transition of 1252.5 keV from the 1295.6 keV level to the 43.0 keV (Iπ = 2+) level. Based on this, the most likely spin of the 1295.6 keV level would be 3 or 4. Since the 489.8 keV γ-ray is in coincidence with all of the γ-rays originating from the 1295.6 keV level, it would be a transition from the 1785.4 keV level to the 1295.6 keV level. The γ-ray of 176.7 keV was observed to be in coincidence with all of the γ-rays of the decay cascades that started from the 1151.0 level. This observation suggested that the 1327.7 keV level decays directly to the 1151.0 keV level. Another transition of 690.7 keV seen in coincidence with 920.8 keV suggests that it originated from a level at 1654.5 keV.
A tentative partial level scheme for the 244Bk → 244Cm decay with eight new levels was determined, which is shown in figure 4. Only a few transitions among the existing levels of 244Cm [1, 19] were observed. Therefore, only two reported levels of 244Cm (2+ and 4+) were included, as they fit well with the transitions seen in the present study. These levels and γ-ray energies are marked with an asterisk (*) in the figure. Several γ-rays of 244Bk, particularly with large relative intensities, have been placed in this level scheme. The γ-rays, which could not be placed, are underlined in table 2. Also, based on the relative intensities of the γ-rays and accounting for the unplaced γ-rays that could not be placed in the level scheme, a lower limit of the branching intensity (>40%) of the EC-decay was assigned to the 1151.0 keV level of 244Cm. A measurement of the conversion electrons in coincidence with these γ-rays will further confirm the proposed decay to the 43.0 keV (Iπ = 2+) level of 244Cm and the ground state assignment of 244Bk.
Figure 4. Tentative partial level scheme for the EC-decay of 244Bk. The γ-ray energies and levels marked with '*' are adopted from the already known levels of 244Cm [6]. All of the energies of the levels and γ-rays are in keV.
Download figure:
Standard image High-resolution image
4. Conclusions
The isotopes of the element 97 (berkelium) were produced by bombarding a natural uranium target with 11B beam. The berkelium fraction was obtained after the removal of the majority of the fission products and the target (uranium) by a scheme of radiochemical separations. The present method provided sufficiently large activity of 244Bk, which helped us to obtain a more precise data on the half-life and relative γ-ray intensities of 244Bk. The newly proposed half-life of 244Bk obtained in the present work is higher than the previously reported value by about 15% and is much closer to the theoretically calculated number. With the help of the γ-γ coincidence data, the ground state spin of 244Bk has been ascertained. A tentative level scheme for the 244Bk → 244Cm decay with eight new levels has also been proposed.
Acknowledgements
The authors gratefully acknowledge Dr A Goswami, Head, Radiochemistry Division, BARC for his interest and valuable suggestions. The authors thank Dr Priya Maheshwari and Dr D Dutta for their help during the experiment. The authors also thank Mr A Mahadkar of Target Lab, TIFR for rolling the U targets. We also thank the operating staff of BARC-TIFR Pelletron facility, Mumbai for their cooperation during the experiment.